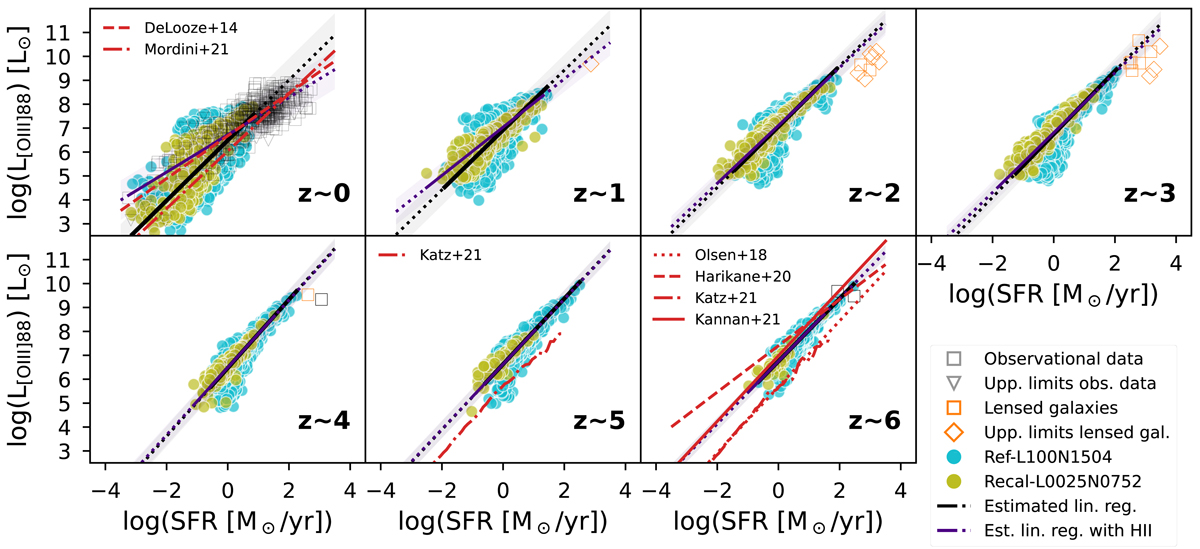
Fig. 10.
Download original image
As in Fig. 2, but for the [O III] 88 μm line. The obtained relations from the EAGLE simulations are compared with relations derived from simulations (Olsen et al. 2018; Katz et al. 2022; Kannan et al. 2022) and observations (De Looze et al. 2014; Harikane et al. 2020; Mordini et al. 2021). Linear relations inferred from our models using only H II regions are shown as indigo solid lines over the dynamic range covered by the simulations and extrapolated to lower and higher SFRs as indigo dotted lines; the shaded area represents the 1σ error (see Appendix C).
Current usage metrics show cumulative count of Article Views (full-text article views including HTML views, PDF and ePub downloads, according to the available data) and Abstracts Views on Vision4Press platform.
Data correspond to usage on the plateform after 2015. The current usage metrics is available 48-96 hours after online publication and is updated daily on week days.
Initial download of the metrics may take a while.