Open Access
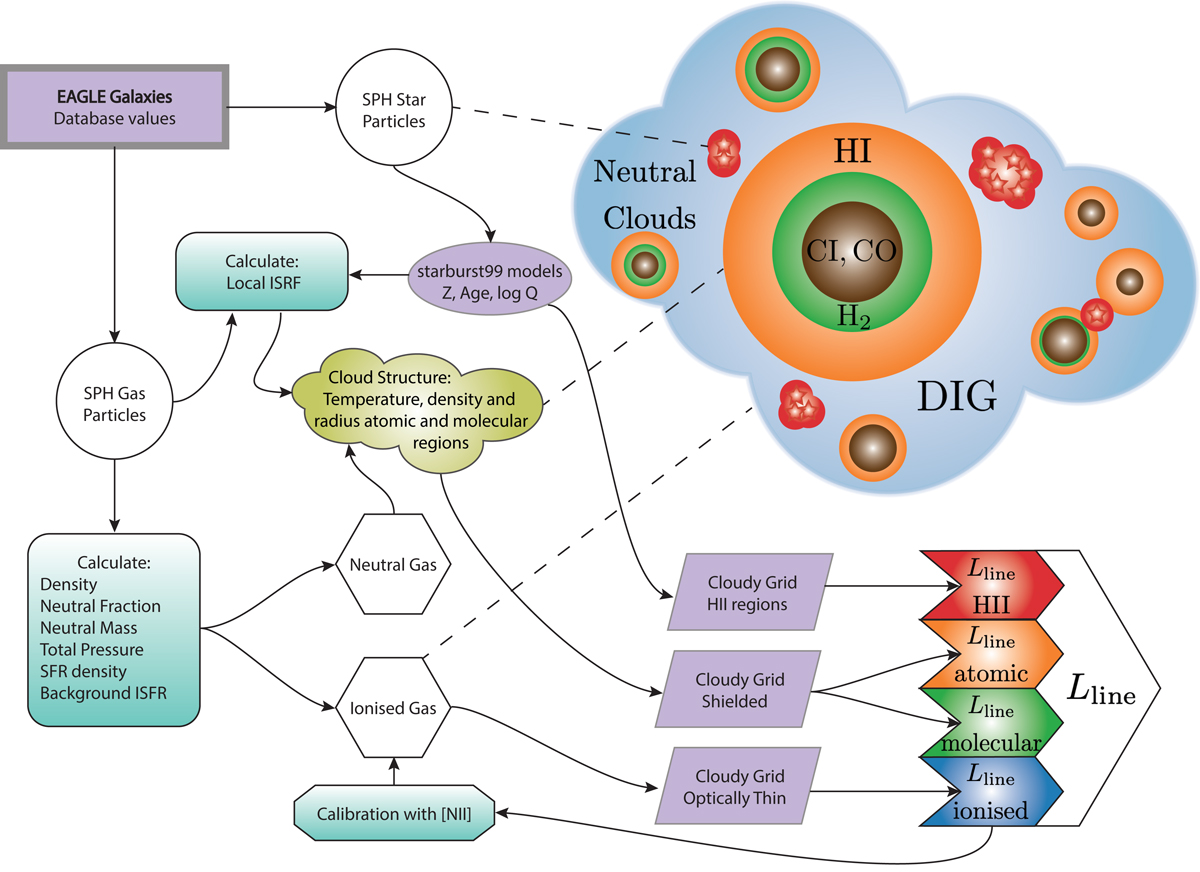
Fig. 1.
Download original image
Flowchart of our sub-grid procedures applied to the SPH to simulate FIR line emission in post-processing. This flowchart is similar to the one presented in Paper I; the main difference is the added H II regions as a new ISM phase. The dashed lines connect the gas and star environments to the ingredients of the model.
Current usage metrics show cumulative count of Article Views (full-text article views including HTML views, PDF and ePub downloads, according to the available data) and Abstracts Views on Vision4Press platform.
Data correspond to usage on the plateform after 2015. The current usage metrics is available 48-96 hours after online publication and is updated daily on week days.
Initial download of the metrics may take a while.