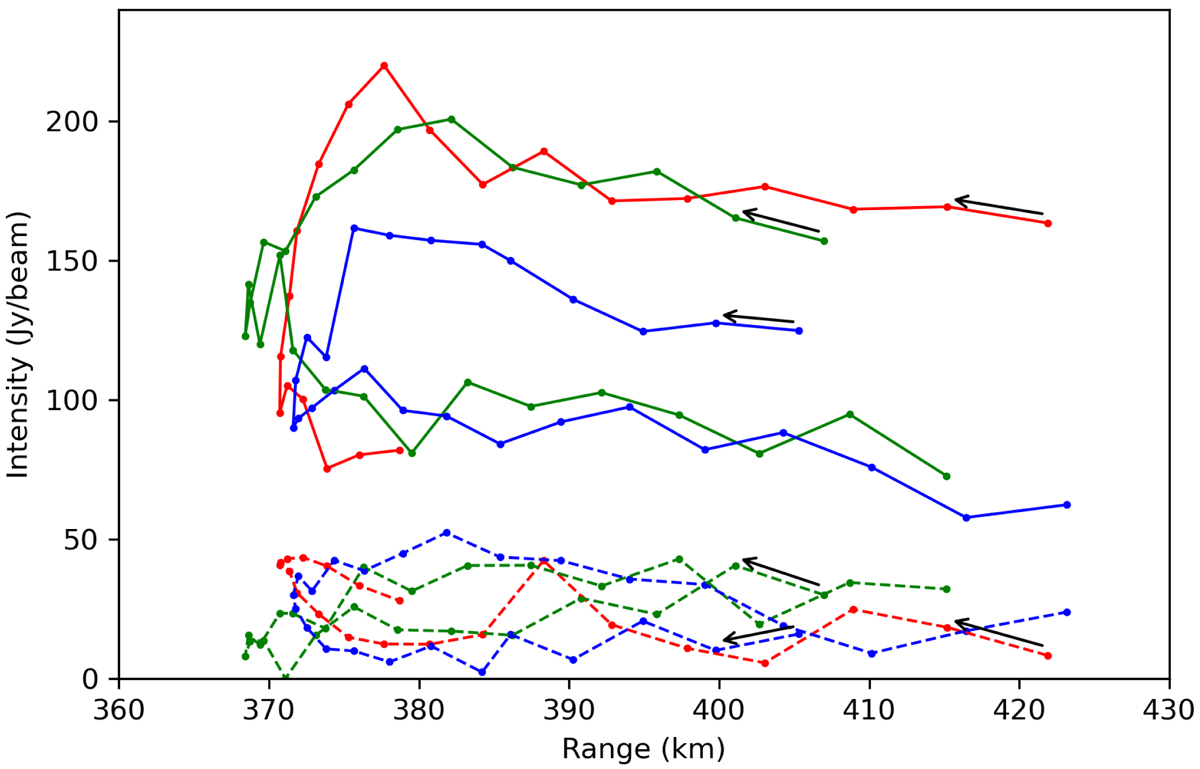
Fig. 4.
Download original image
Range of intensity measurements of three satellites fitted in the train of the Starlink satellites at 159.4 MHz. The three colours identify the particular satellite that was fitted. The dotted lines are for the XX polarisation images and the solid lines are for the YY polarisation images. The arrows show the direction of time.
Current usage metrics show cumulative count of Article Views (full-text article views including HTML views, PDF and ePub downloads, according to the available data) and Abstracts Views on Vision4Press platform.
Data correspond to usage on the plateform after 2015. The current usage metrics is available 48-96 hours after online publication and is updated daily on week days.
Initial download of the metrics may take a while.