Fig. 3.
Download original image
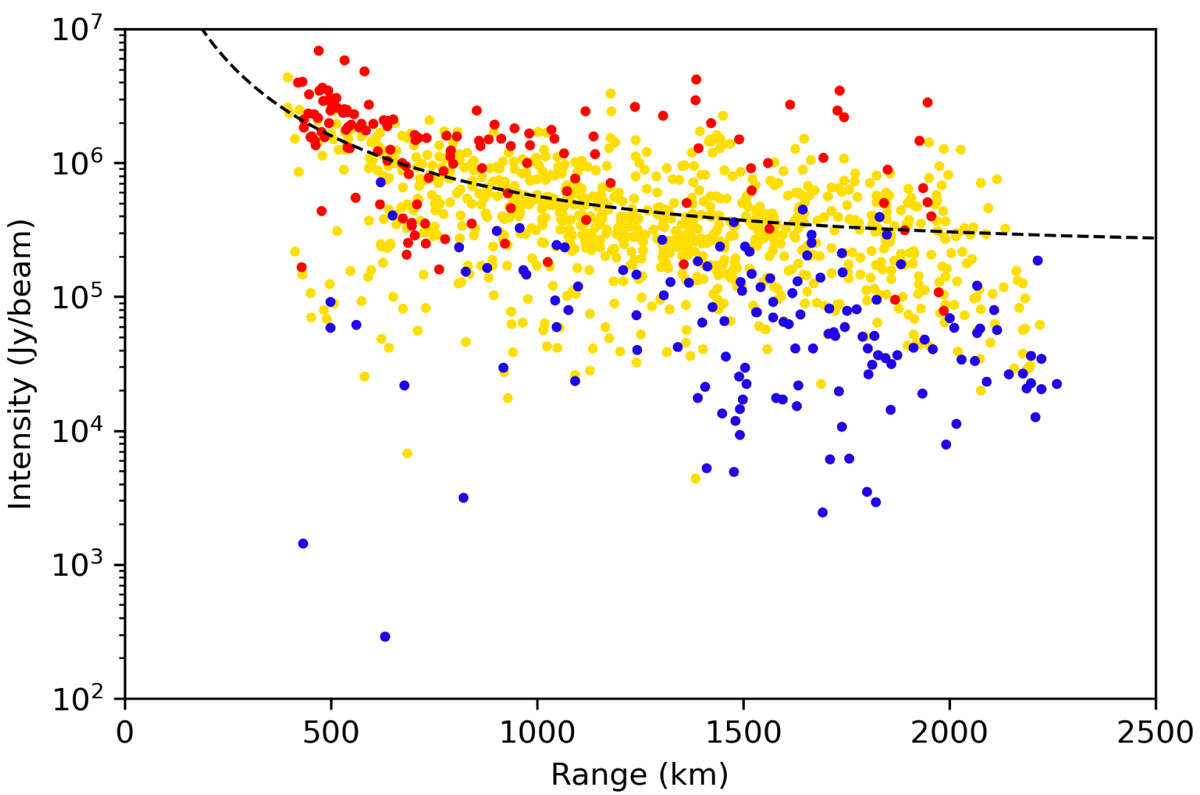
Range of peak intensity measurements for all 1130 flashes detected at 137.5 MHz. The red points represent the flash with the highest intensity for each NORAD identifier, while the blue points represent the lowest one. The yellow points represent the rest of the flashes. An inverse square law (![]() ) was fitted to these data points to account for the spherical isotropic propagation of the transmission and to guide the reader’s eye.
) was fitted to these data points to account for the spherical isotropic propagation of the transmission and to guide the reader’s eye.
Current usage metrics show cumulative count of Article Views (full-text article views including HTML views, PDF and ePub downloads, according to the available data) and Abstracts Views on Vision4Press platform.
Data correspond to usage on the plateform after 2015. The current usage metrics is available 48-96 hours after online publication and is updated daily on week days.
Initial download of the metrics may take a while.