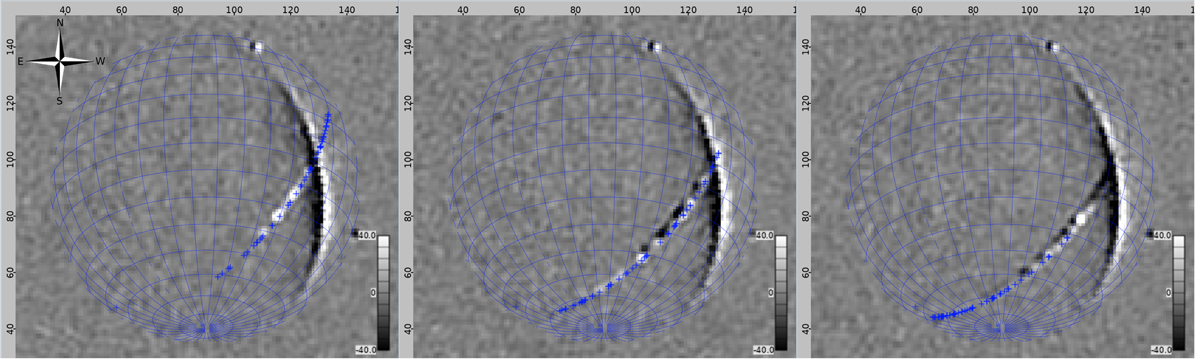
Fig. 2.
Download original image
Three images of the detected Starlink train at 159.4 MHz. The images from left to right are at times UTC 2021-11-16 10:07:10, 10:07:49, and 10:08:29. The blue grid is an astronomical projection to show the area of visible sky. The blue crosses are the TLE-predicted positions of all Starlink satellites detected during this dataset. The vertical band on the right-hand side of the image is due to the motion of the Milky Way over the differencing period. The median MAD value at the zenith across all difference images is 1.2 Jy beam−1.
Current usage metrics show cumulative count of Article Views (full-text article views including HTML views, PDF and ePub downloads, according to the available data) and Abstracts Views on Vision4Press platform.
Data correspond to usage on the plateform after 2015. The current usage metrics is available 48-96 hours after online publication and is updated daily on week days.
Initial download of the metrics may take a while.