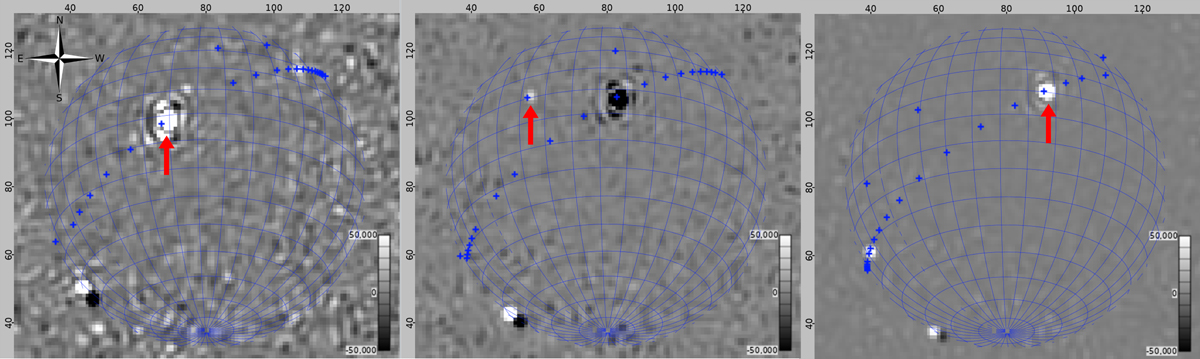
Fig. 1.
Download original image
Three images of Starlink satellites detected at 137.5 MHz. The images from left to right are at times UTC 2023-03-18 00:59:46, 01:01:04, and 01:02:24. The blue grid is an astronomical projection to show the area of visible sky. The blue crosses are the TLE-predicted positions of all Starlink satellites detected during this dataset. The red arrows denote detections of NORAD 55 358, NORAD 55 377, and NORAD 55 340 from left to right. The satellite in the bottom-left corner of all three images is not a Starlink satellite (NORAD 28 654–NOAA 18). Arrows indicate the detections to which we referred. The median of the median absolute deviation (MAD) value at the zenith in each image across all difference images at this frequency is 310 Jy beam−1 and is high due to there nearly always being a satellite transmitting overhead throughout the entire dataset. The MAD of images was as low as ∼0.6 Jy beam−1 when there were no transmitters or Milky Way or Sun present.
Current usage metrics show cumulative count of Article Views (full-text article views including HTML views, PDF and ePub downloads, according to the available data) and Abstracts Views on Vision4Press platform.
Data correspond to usage on the plateform after 2015. The current usage metrics is available 48-96 hours after online publication and is updated daily on week days.
Initial download of the metrics may take a while.