Fig. 4.
Download original image
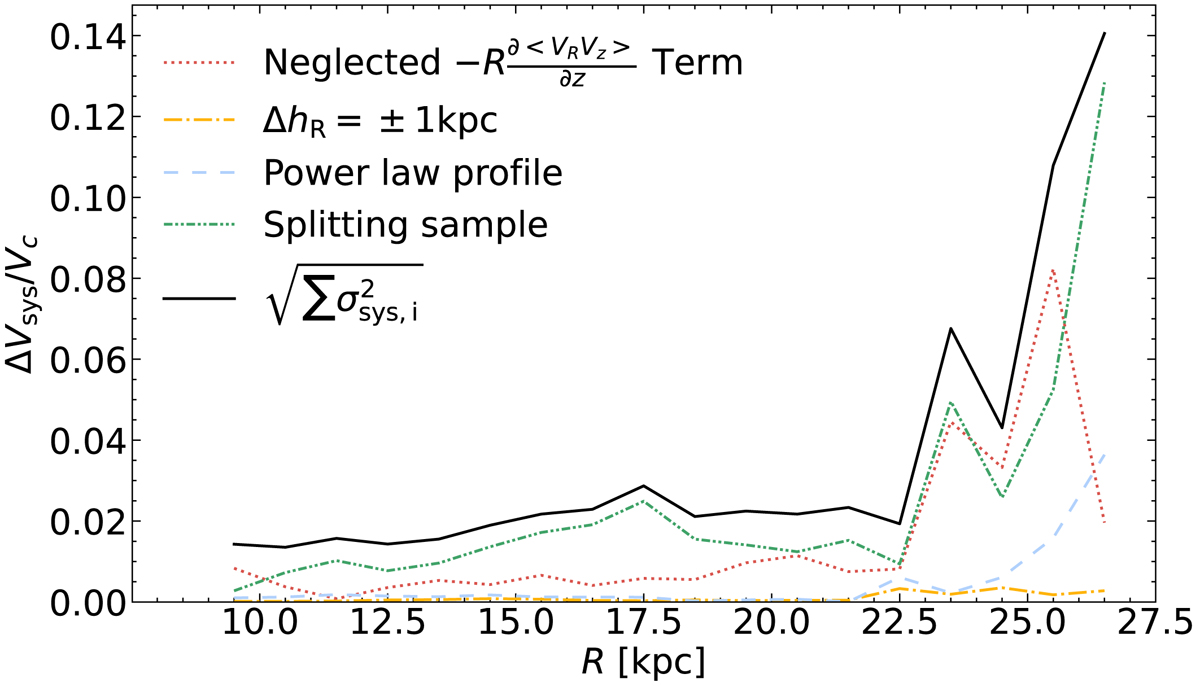
Summary of potential systematic uncertainties in the circular velocity curve at a vertical height of |z|< 3 kpc. We estimate systematic uncertainties arising from the neglected cross-term (see the red-dotted line), from varying the exponential scale length of the density profile (orange-dashed line), from passing from an exponential to a power law (blue-dashed line) with an index α = −2.25, and finally after splitting the sample into two parts (green-dotted line). The total systematic uncertainty (black-solid line) is at the 2% level up to R = 22.5 kpc, and then increases at larger radii.
Current usage metrics show cumulative count of Article Views (full-text article views including HTML views, PDF and ePub downloads, according to the available data) and Abstracts Views on Vision4Press platform.
Data correspond to usage on the plateform after 2015. The current usage metrics is available 48-96 hours after online publication and is updated daily on week days.
Initial download of the metrics may take a while.