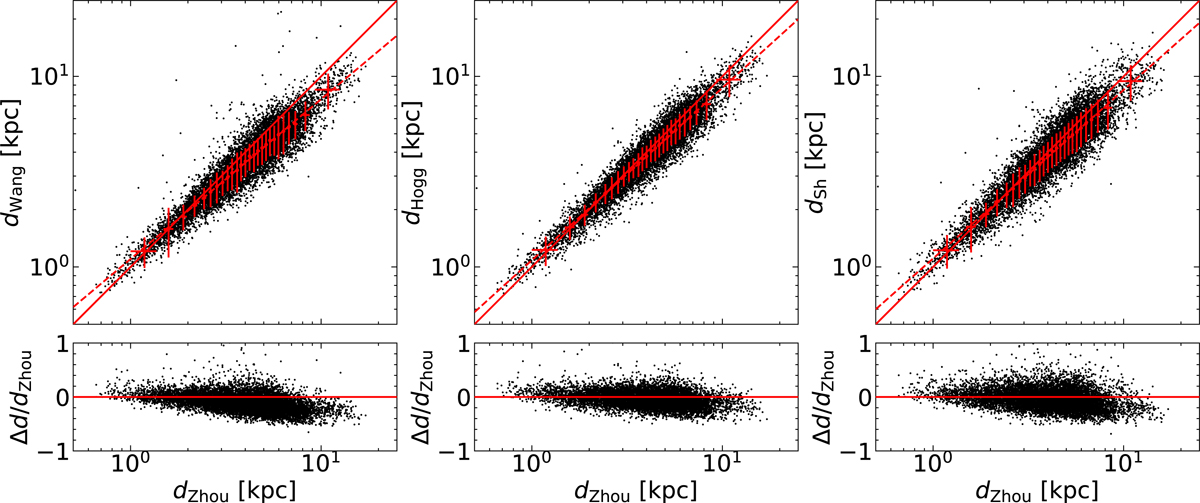
Fig. B.1.
Download original image
Comparison of distance estimates made by Zhou et al. (2023) to those made by Wang et al. (2016), Hogg et al. (2019), and StarHorse (Queiroz et al. 2023) in the top panels, respectively. The solid line presents a one-to-one correspondence. The dashed line presents the best linear fit on the logarithmic scale. Red points and error bars indicate the median and standard deviation per 400 data points. The ratios Δd/dzhou are shown in the bottom panels.
Current usage metrics show cumulative count of Article Views (full-text article views including HTML views, PDF and ePub downloads, according to the available data) and Abstracts Views on Vision4Press platform.
Data correspond to usage on the plateform after 2015. The current usage metrics is available 48-96 hours after online publication and is updated daily on week days.
Initial download of the metrics may take a while.