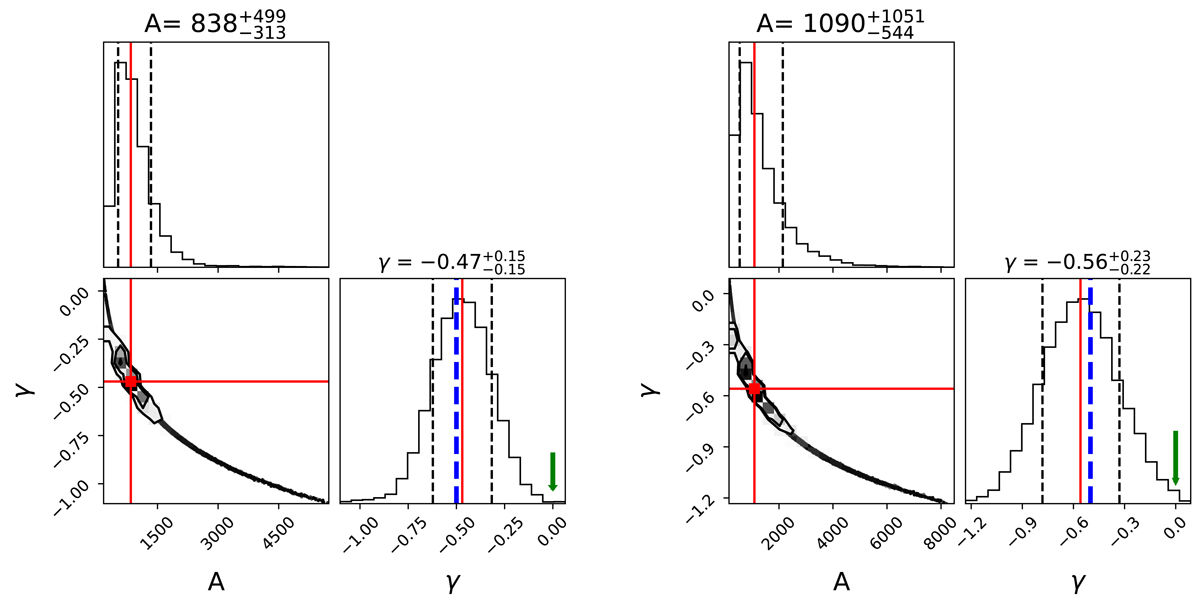
Fig. 10.
Download original image
Posterior distributions for the parameters A and γ. We show fits to the RC of this work (left panel) and to that of Ou et al. (2023, right panel) including systematics uncertainties. Histograms of parameters A and γ correspond to the maximum density distribution. Red solid lines represent the median of the posterior distributions. Black dashed lines correspond to 1σ uncertainty. Blue dashed lines correspond to the slope of the Keplerian decline, n = −0.5. Green arrows indicate the slope of a flat RC (n = 0).
Current usage metrics show cumulative count of Article Views (full-text article views including HTML views, PDF and ePub downloads, according to the available data) and Abstracts Views on Vision4Press platform.
Data correspond to usage on the plateform after 2015. The current usage metrics is available 48-96 hours after online publication and is updated daily on week days.
Initial download of the metrics may take a while.