Fig. 3.
Download original image
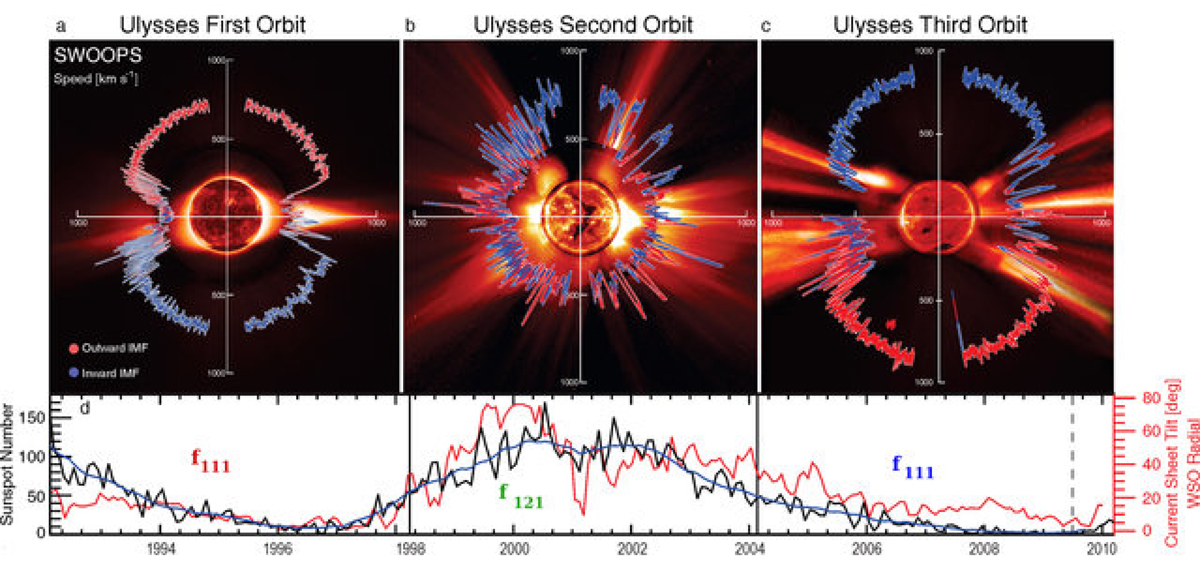
Adapted Figs. 1(a–d) from McComas et al. (2008), original caption ‘(a–c) Polar plots of the solar wind speed, colored by IMF polarity for Ulysses’ three polar orbits colored to indicate measured magnetic polarity. In each, the earliest times are on the left (nine o’clock position) and progress aroundcounterclockwise. (d) Contemporaneous values for the smoothed sunspot number (black) and heliospheric current sheettilt (red), lined up to match Figs. 1a–c. In Figs. 1a–c, the solar wind speed is plotted over characteristic solarimages for solar minimum for cycle 22 (8/17/96), solar maximum for cycle 23 (12/07/00), and solar minimum for cycle 23(03/28/06). From the center out, we blend images from the Solar and Heliospheric Observatory (SOHO) Extremeultraviolet Imaging Telescope (Fe XII at 1950 nm), the Mauna Loa K coronameter (700–950 nm), and the SOHO C2white light coronagraph.
Current usage metrics show cumulative count of Article Views (full-text article views including HTML views, PDF and ePub downloads, according to the available data) and Abstracts Views on Vision4Press platform.
Data correspond to usage on the plateform after 2015. The current usage metrics is available 48-96 hours after online publication and is updated daily on week days.
Initial download of the metrics may take a while.