Fig. A.2.
Download original image
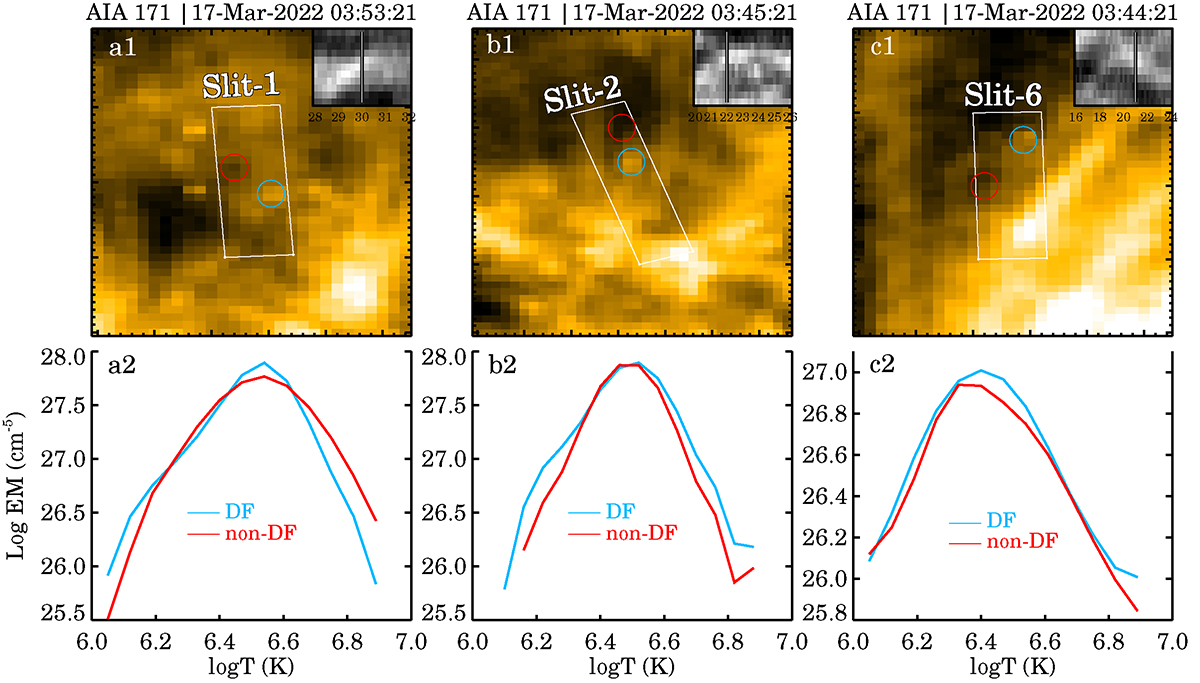
Additional examples of EM analysis of DFs. Panel descriptions are same as in Fig. 5. The tracks that those DFs create in AIA 171 maps are shown in insets of panels a1, b1, and c1. The vertical lines in these inset panels highlight when the EM measurement was carried out.
Current usage metrics show cumulative count of Article Views (full-text article views including HTML views, PDF and ePub downloads, according to the available data) and Abstracts Views on Vision4Press platform.
Data correspond to usage on the plateform after 2015. The current usage metrics is available 48-96 hours after online publication and is updated daily on week days.
Initial download of the metrics may take a while.