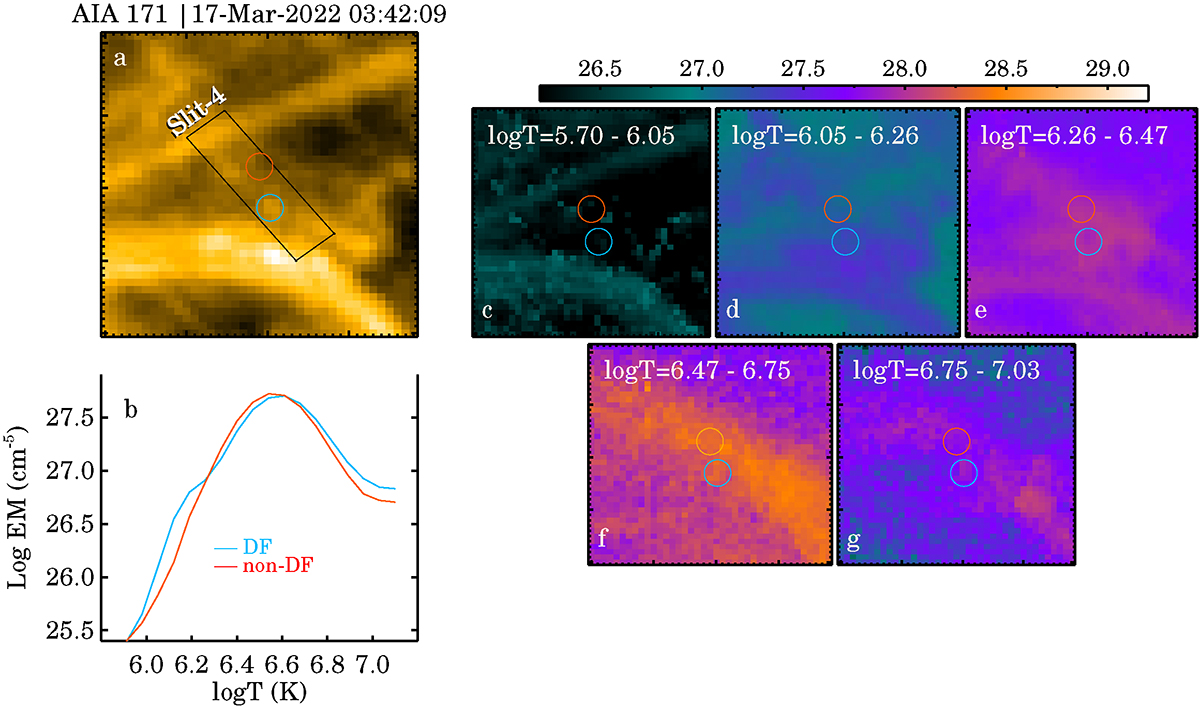
Fig. 5.
Download original image
Emission measure (EM) analysis of a DF. Panel a shows an AIA 171 Å image with the DF outlined by the cyan circle. The EM curve (derived at 03:42 UT) of the central pixel of that circle is shown in panel b (the blue curve), while the red curve shows the same but for a pixel away from the DF as outlined by the red circle in panel a. Panels c–g show 2D EM maps (of the FoV shown in panel a) at specific temperature bins, as noted in each panel.
Current usage metrics show cumulative count of Article Views (full-text article views including HTML views, PDF and ePub downloads, according to the available data) and Abstracts Views on Vision4Press platform.
Data correspond to usage on the plateform after 2015. The current usage metrics is available 48-96 hours after online publication and is updated daily on week days.
Initial download of the metrics may take a while.