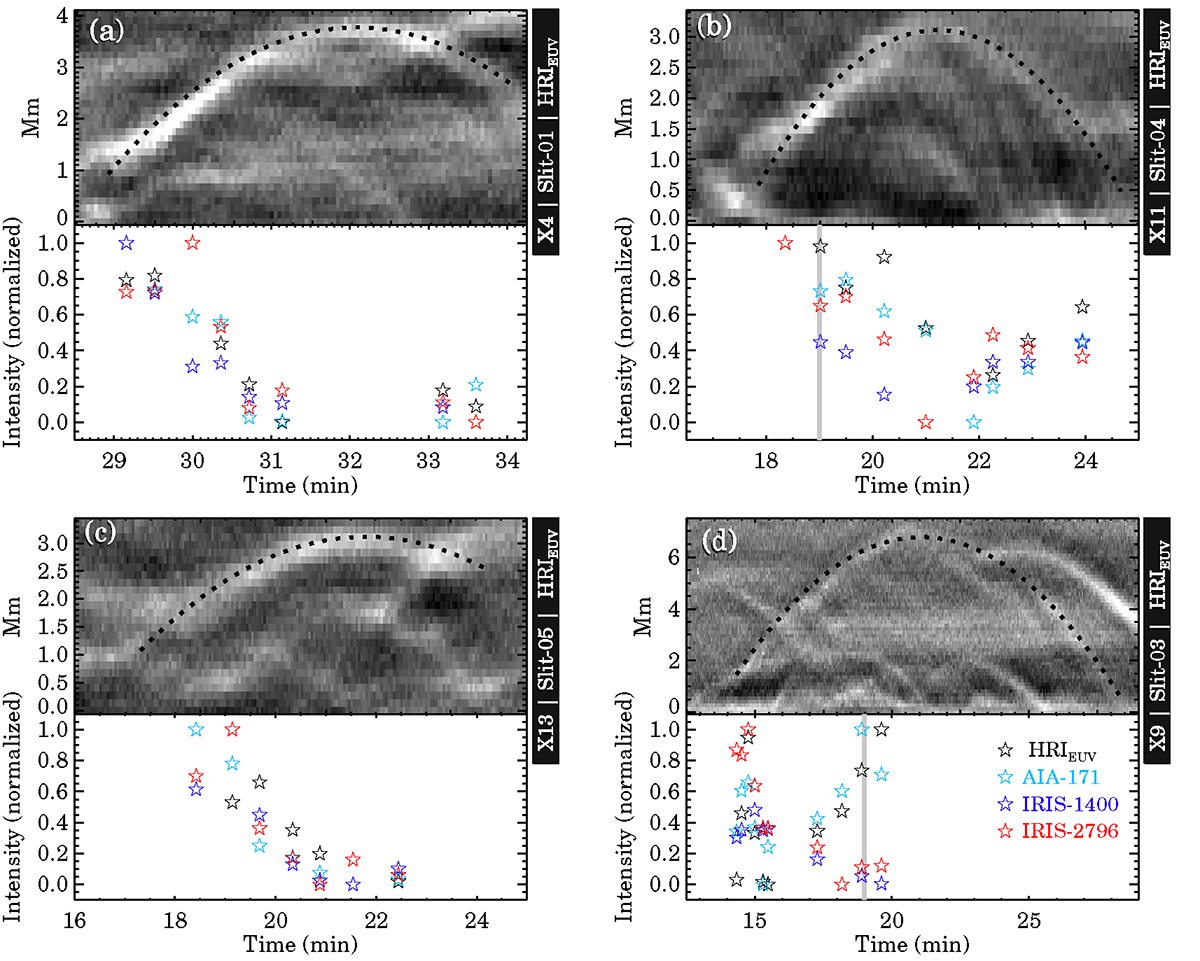
Fig. 4.
Download original image
Intensity evolution of four selected DFs. In panel a, the top section shows the HRIEUVX − T maps (between t = 28 and 34 min) of slit-1, while the bottom section shows the evolution of intensities in four different imaging channels (HRIEUV in black, AIA 171 Å in cyan, IRIS 1400 Å in blue and IRIS 2796 Å in red), of the DF that created the parabolic trajectory in the X − T map. The black dotted line in the top section is the parabolic fit to the observed bright track. Panels b–d show the same but for slit-4, slit-5, and slit-3. The grey vertical lines in panels b and d indicate the time when the emission measure analyses as those shown in Figs. 5 and A.1 are performed. Animations associated to this figure are available online.
Current usage metrics show cumulative count of Article Views (full-text article views including HTML views, PDF and ePub downloads, according to the available data) and Abstracts Views on Vision4Press platform.
Data correspond to usage on the plateform after 2015. The current usage metrics is available 48-96 hours after online publication and is updated daily on week days.
Initial download of the metrics may take a while.