Fig. C.2.
Download original image
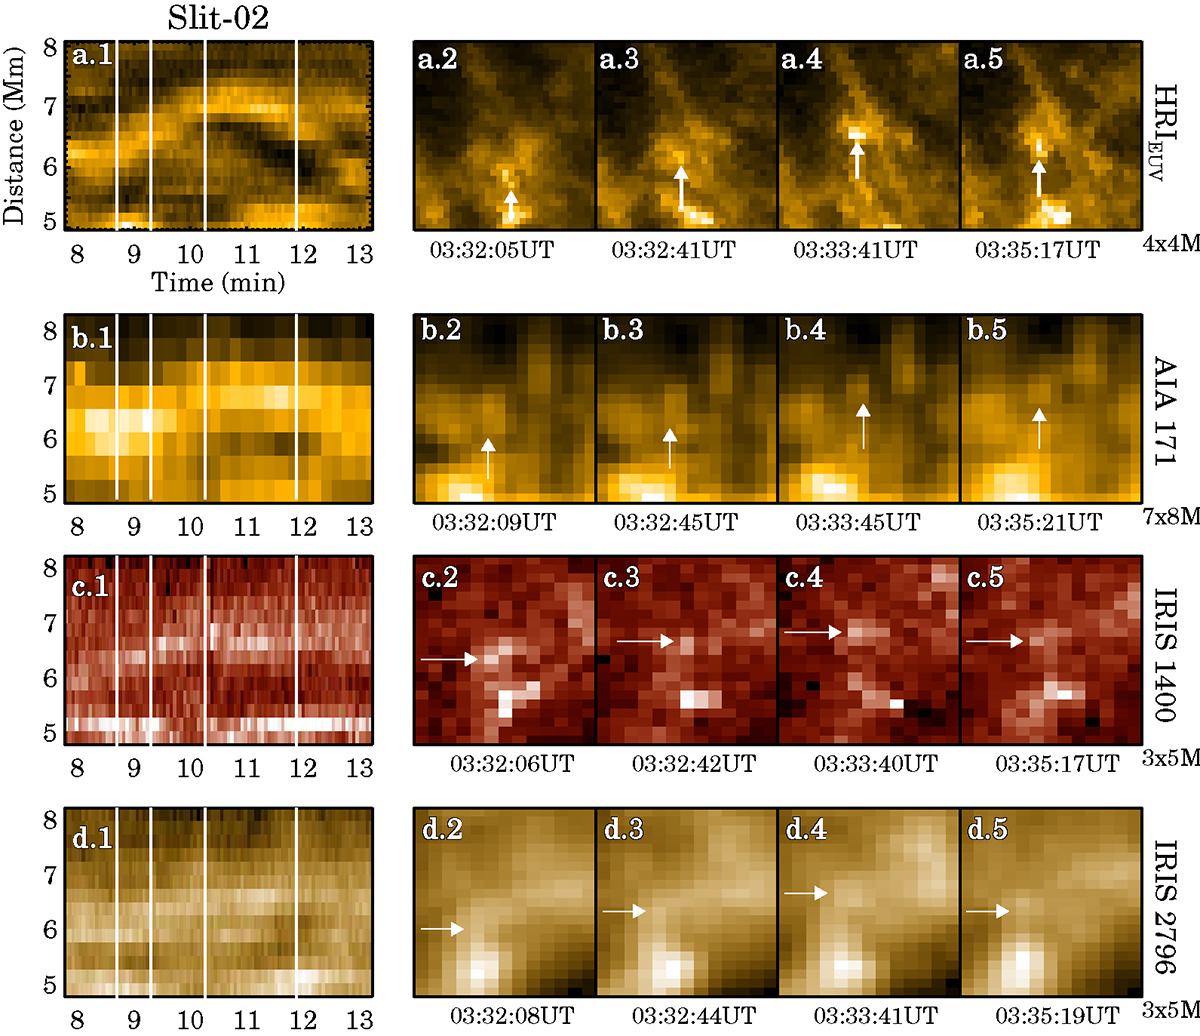
Evolution of a DF (from slit-02) across channels. Panel a.1 shows the bright (parabolic) track that the DF creates in the EUI X-T map. The four vertical lines mark the time stamps of snapshots in panels a.2, a.3, a.4, and, a.4, in which the white-arrows point toward the instantaneous position of the DF. Panels b-d have the same format but for AIA 171 Å, IRIS 1400 Å, IRIS 2796 Å observations. An animated version of this figure is available online.
Current usage metrics show cumulative count of Article Views (full-text article views including HTML views, PDF and ePub downloads, according to the available data) and Abstracts Views on Vision4Press platform.
Data correspond to usage on the plateform after 2015. The current usage metrics is available 48-96 hours after online publication and is updated daily on week days.
Initial download of the metrics may take a while.