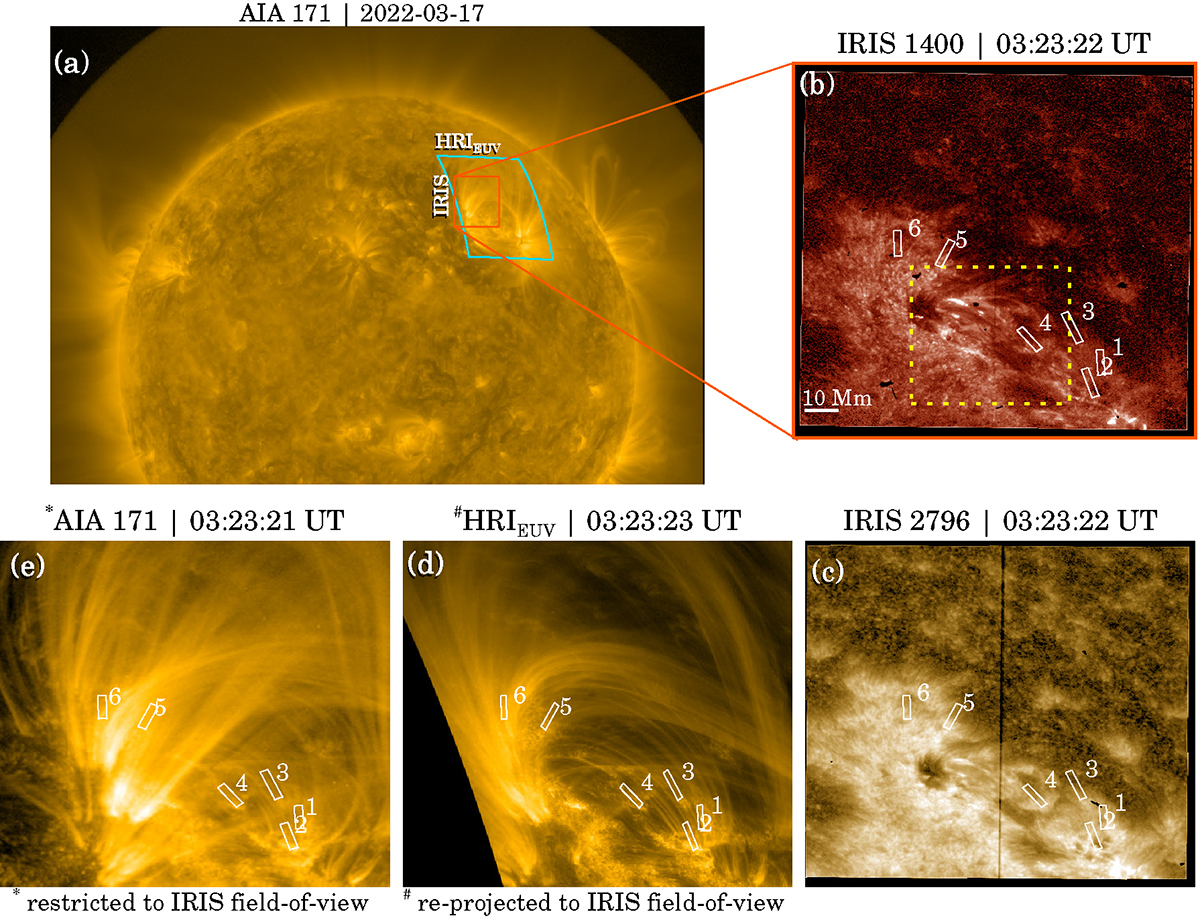
Fig. 1.
Download original image
Overview of the coordinated EUI-AIA-IRIS observation on 2022-03-17. Panel a shows the AIA 171 Å image in the background while the IRIS and EUI FoVs are marked by red and cyan rectangles, respectively. Panels b and c present the IRIS 1400 Å and 2796 Å slit jaw images, while panel d shows the EUI image after reprojecting it onto the IRIS FoV. Panel e shows the same but for AIA 171 Å channel (without reprojection). The white boxes in panels b–e mark the locations of the artificial slits that are used to derive the space–time maps. The yellow box in panel b outlines the region analysed in Fig. D.1. Panels a–e are ordered clockwise.
Current usage metrics show cumulative count of Article Views (full-text article views including HTML views, PDF and ePub downloads, according to the available data) and Abstracts Views on Vision4Press platform.
Data correspond to usage on the plateform after 2015. The current usage metrics is available 48-96 hours after online publication and is updated daily on week days.
Initial download of the metrics may take a while.