Fig. 5
Download original image
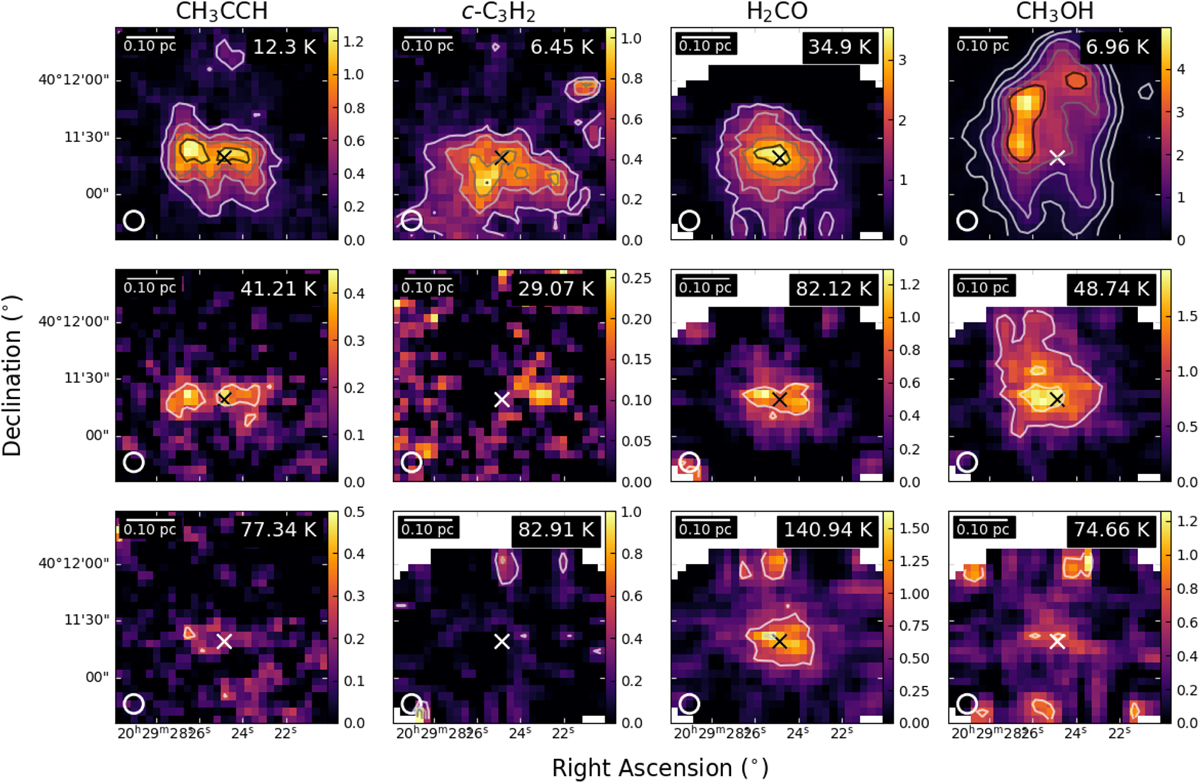
AFGL 2591 integrated intensity, ![]() , maps of rotational transition lines spanning a range of energy levels. The upper state energy level is indicated in the top right-hand corner and the beam size in the bottom left-hand corner. The source VLA 3 is noted by a white or black ‘x’. CH3CCH, in the first column, c-C3H2, in the second, H2CO, in the third, have contour levels of 10, 20, 30, and 40 times the noise level of the respective frequency range. CH3OH, in the fourth column, has contour levels of 10, 20, 40, 80, and 120 times the noise level of the respective frequency range.
, maps of rotational transition lines spanning a range of energy levels. The upper state energy level is indicated in the top right-hand corner and the beam size in the bottom left-hand corner. The source VLA 3 is noted by a white or black ‘x’. CH3CCH, in the first column, c-C3H2, in the second, H2CO, in the third, have contour levels of 10, 20, 30, and 40 times the noise level of the respective frequency range. CH3OH, in the fourth column, has contour levels of 10, 20, 40, 80, and 120 times the noise level of the respective frequency range.
Current usage metrics show cumulative count of Article Views (full-text article views including HTML views, PDF and ePub downloads, according to the available data) and Abstracts Views on Vision4Press platform.
Data correspond to usage on the plateform after 2015. The current usage metrics is available 48-96 hours after online publication and is updated daily on week days.
Initial download of the metrics may take a while.