Fig. 3
Download original image
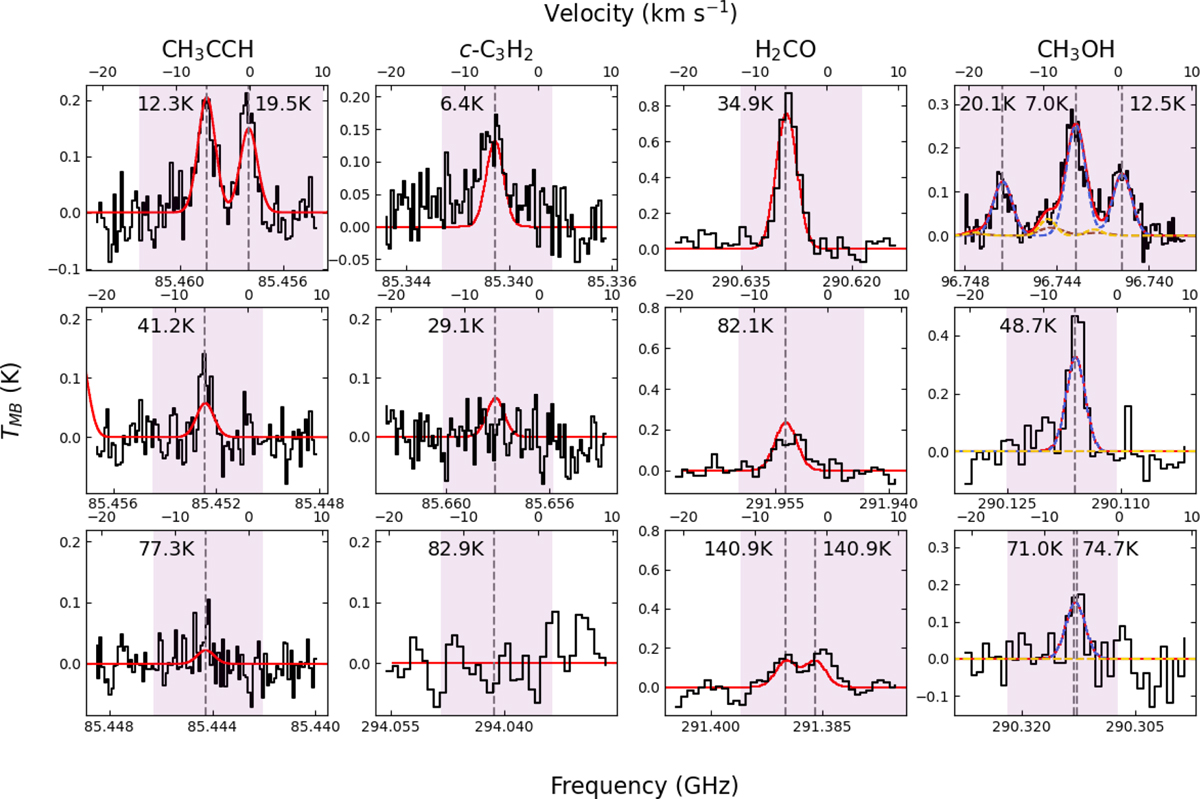
Select transition lines of the carbon chain molecules, CH3CCH and c-C3H2, the complex organic molecules CH3OH, and the precursor complex organic molecule H2CO, at the central pixel of the AFGL 2591 GBT and IRAM maps. The chosen lines represent a range of different upper energy levels, which are indicated in black on the plot. The dashed grey line represents the observed transition frequency at this location. The observed data is shown in black. The model spectra, to be discussed in Sect. 4.2 are shown in colour. The red solid line represents the total model, and the sole component if only one component is fit. For the multi-component fit in CH3OH the separate components are shown in blue, yellow, and brown dashed lines.
Current usage metrics show cumulative count of Article Views (full-text article views including HTML views, PDF and ePub downloads, according to the available data) and Abstracts Views on Vision4Press platform.
Data correspond to usage on the plateform after 2015. The current usage metrics is available 48-96 hours after online publication and is updated daily on week days.
Initial download of the metrics may take a while.