Fig. A.2
Download original image
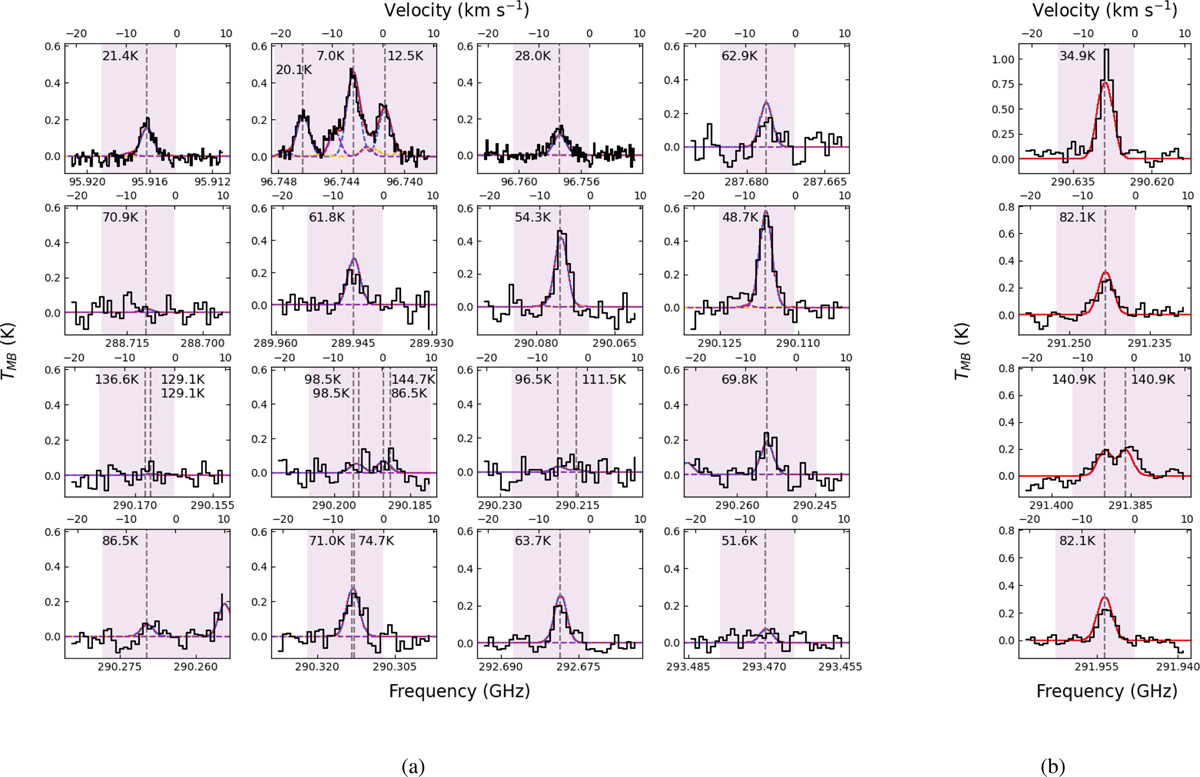
Model spectrum, in colour, over the observed data, in black, of AFGL 2591 for transition lines of (a) CH3OH on the brightest pixel of the CH3OH on the brightest pixel of the CH3OH 60,6,0−50,5,0 (Eup = 48 K) line, and (b) H2CO on the brightest pixel of the H2CO 40,4−30,3 (Eup = 35 K) line. Three components are used to fit CH3OH while one component is used to fit H2CO. The dashed grey line represents the observed transition frequency, with the energy level of this transition labelled.
Current usage metrics show cumulative count of Article Views (full-text article views including HTML views, PDF and ePub downloads, according to the available data) and Abstracts Views on Vision4Press platform.
Data correspond to usage on the plateform after 2015. The current usage metrics is available 48-96 hours after online publication and is updated daily on week days.
Initial download of the metrics may take a while.