Fig. 16
Download original image
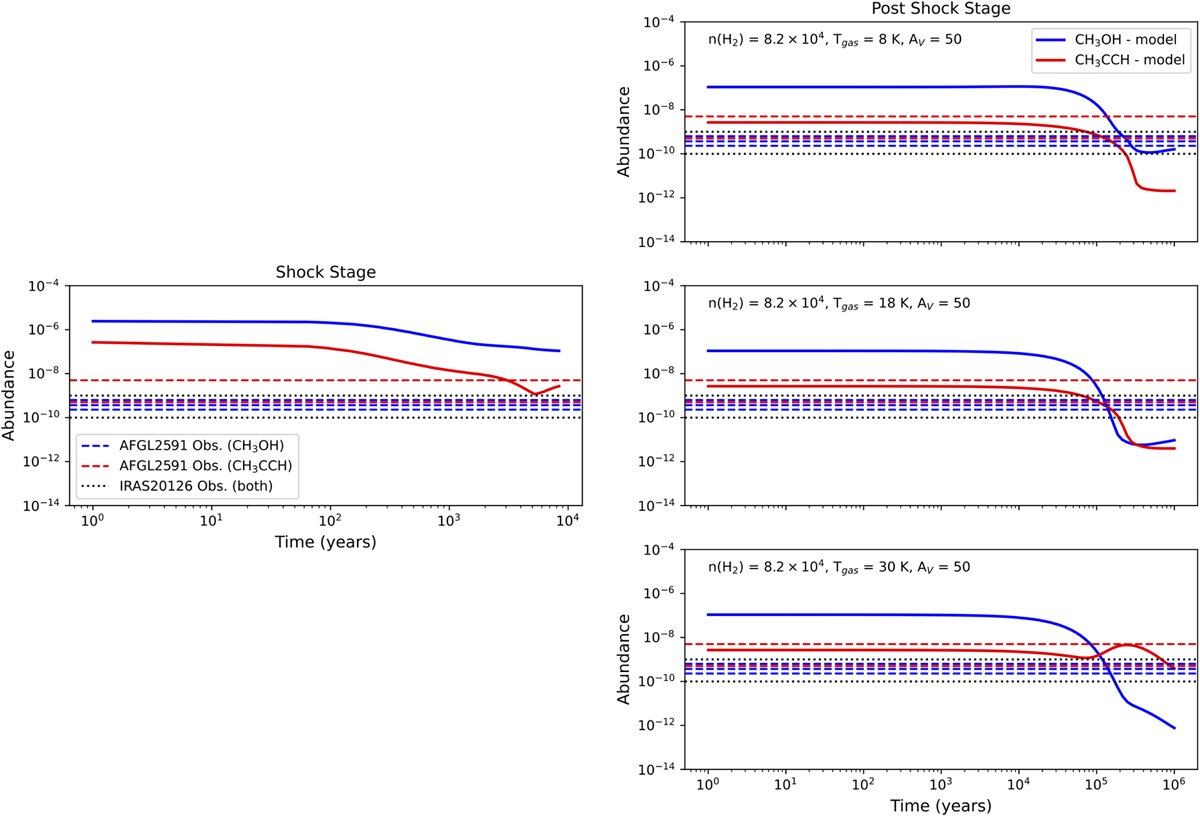
Results from the NAUTILUS three stage chemical evolution model. The solid blue and red lines represent the time evolution of the CH3OH and CH3CCH abundances, respectively. The blue and red dashed horizontal lines indicate the minimum and maximum observed abundances for CH3OH and CH3CCH, respectively, in AFGL 2591. The dotted black line indicates the minimum and maximum observed abundances in IRAS 20126. The left panel shows the shock stage and the right panels show the post shock stage for three different temperatures.
Current usage metrics show cumulative count of Article Views (full-text article views including HTML views, PDF and ePub downloads, according to the available data) and Abstracts Views on Vision4Press platform.
Data correspond to usage on the plateform after 2015. The current usage metrics is available 48-96 hours after online publication and is updated daily on week days.
Initial download of the metrics may take a while.