Open Access
Fig. 12
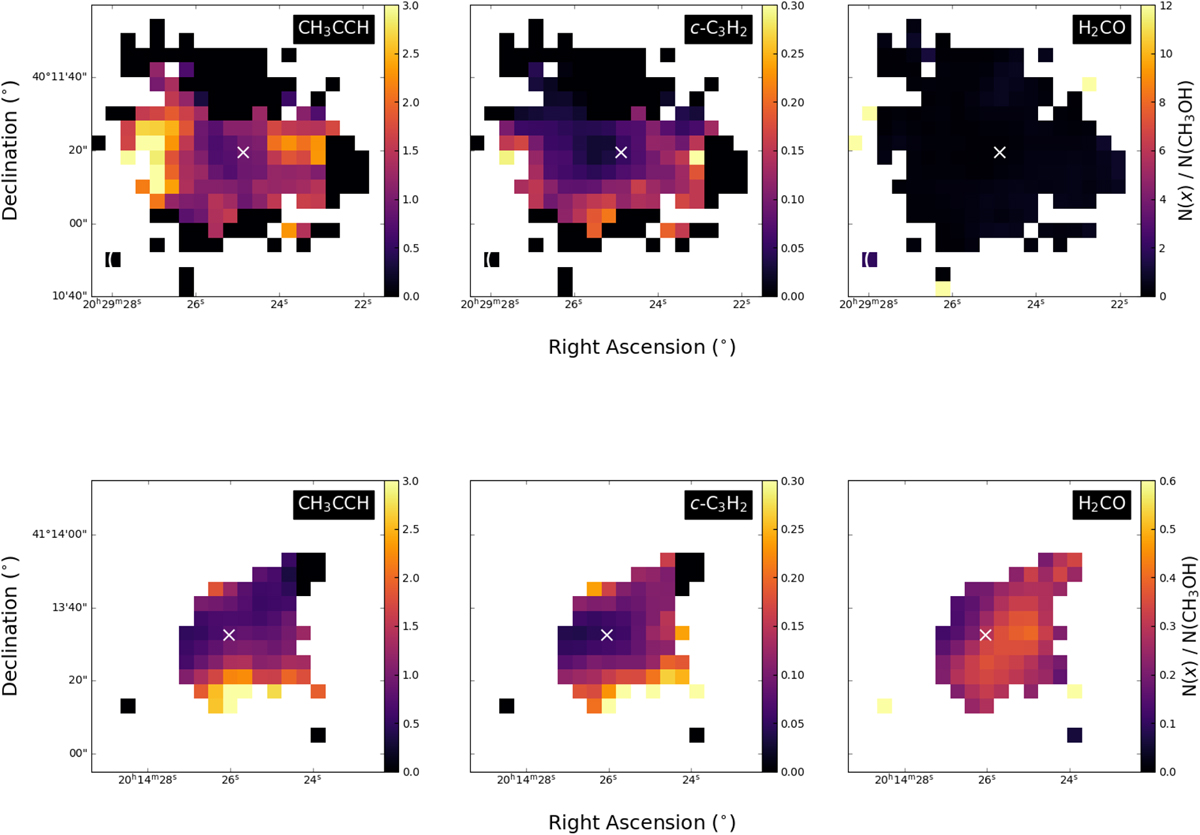
Download original image
Column density ratio maps for CH3CCH, c-C3H2, and H2CO with respect to CH3OH. The upper panel shows AFGL 2591 and the lower panel IRAS 20126. The white ‘x’ represents the protostellar sources within each region.
Current usage metrics show cumulative count of Article Views (full-text article views including HTML views, PDF and ePub downloads, according to the available data) and Abstracts Views on Vision4Press platform.
Data correspond to usage on the plateform after 2015. The current usage metrics is available 48-96 hours after online publication and is updated daily on week days.
Initial download of the metrics may take a while.