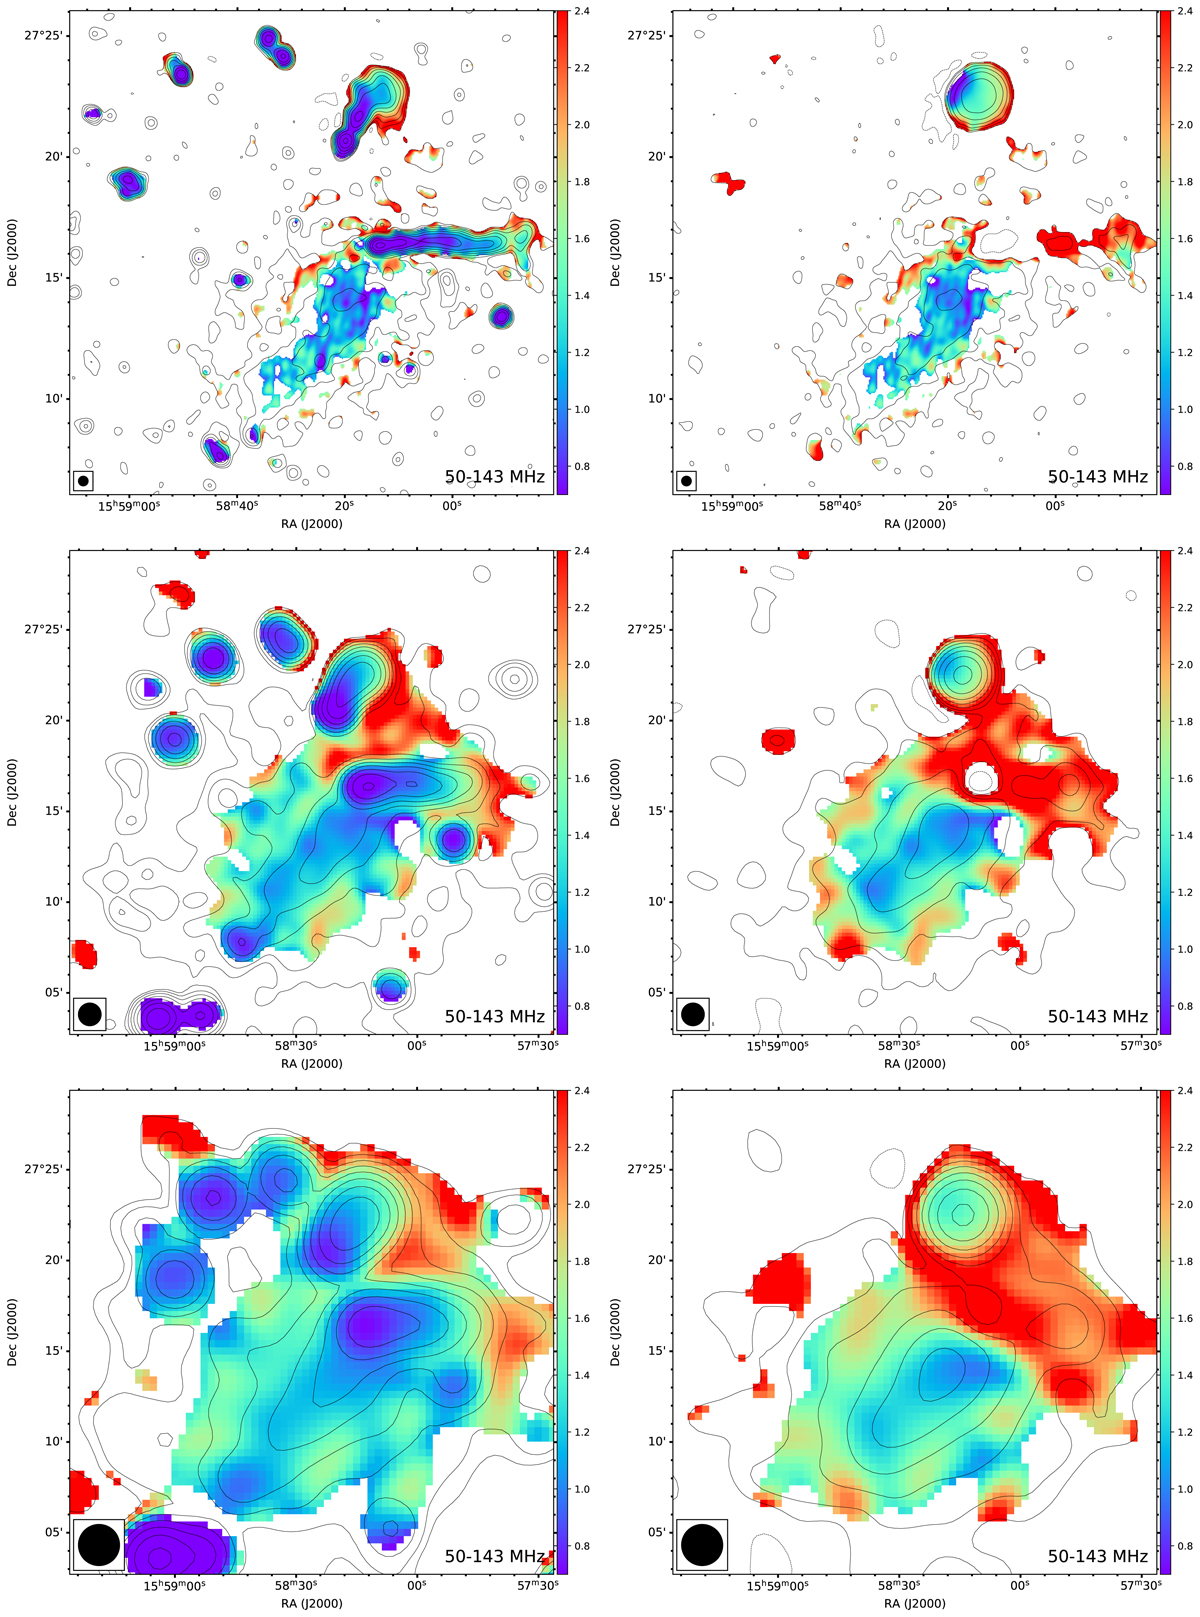
Fig. 8.
Download original image
A2142 spectral index maps between 50 and 143 MHz at various resolutions before (left panels) and after (right panels) the subtraction of the discrete sources. Top: maps at 24″ × 24″ resolution. Middle: maps at 75″ × 75″ resolution. Bottom: maps at 136″ × 136″ resolution. In all the panels, the corresponding contours at 143 MHz are drawn in black.
Current usage metrics show cumulative count of Article Views (full-text article views including HTML views, PDF and ePub downloads, according to the available data) and Abstracts Views on Vision4Press platform.
Data correspond to usage on the plateform after 2015. The current usage metrics is available 48-96 hours after online publication and is updated daily on week days.
Initial download of the metrics may take a while.