Fig. 13.
Download original image
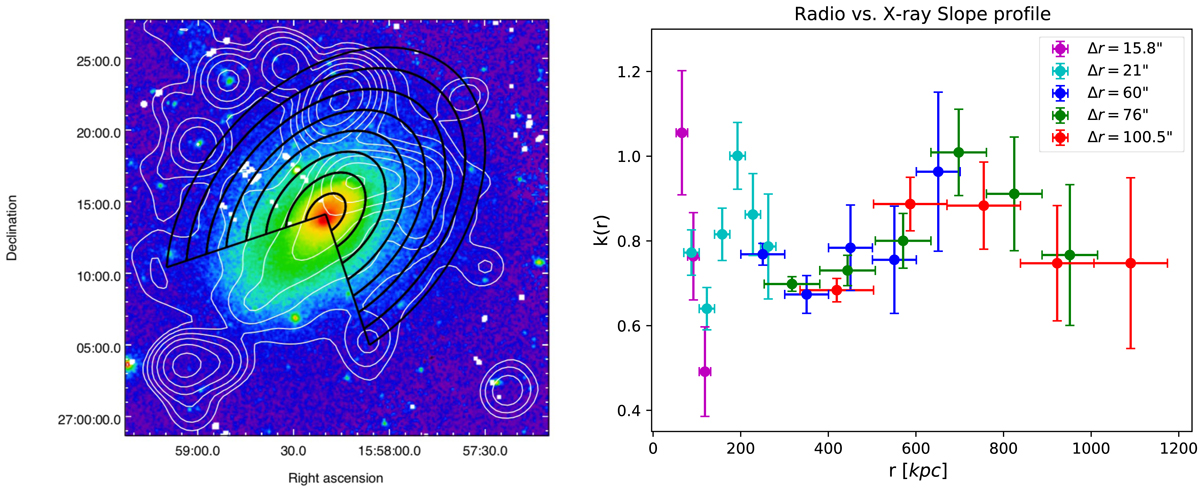
Radial trends of the radio vs. X-ray correlation. Left: example of images (LOFAR HBA contours at 134″ are overlaid on the XMM-Newton image) and elliptical sectors used to measure the surface brightnesses; for ease of inspection, the shown images include the discrete sources, whereas these were subtracted (or masked in case of residuals) during analysis. Right: radio vs. X-ray correlation slope as a function of the radial distance from BCG1. The widths of the concentric elliptical sampling sectors depend on the beam of the radio image and the required S/N, and are reported in the legend. The global trend k(r) is sublinear, albeit with two narrow peaks.
Current usage metrics show cumulative count of Article Views (full-text article views including HTML views, PDF and ePub downloads, according to the available data) and Abstracts Views on Vision4Press platform.
Data correspond to usage on the plateform after 2015. The current usage metrics is available 48-96 hours after online publication and is updated daily on week days.
Initial download of the metrics may take a while.