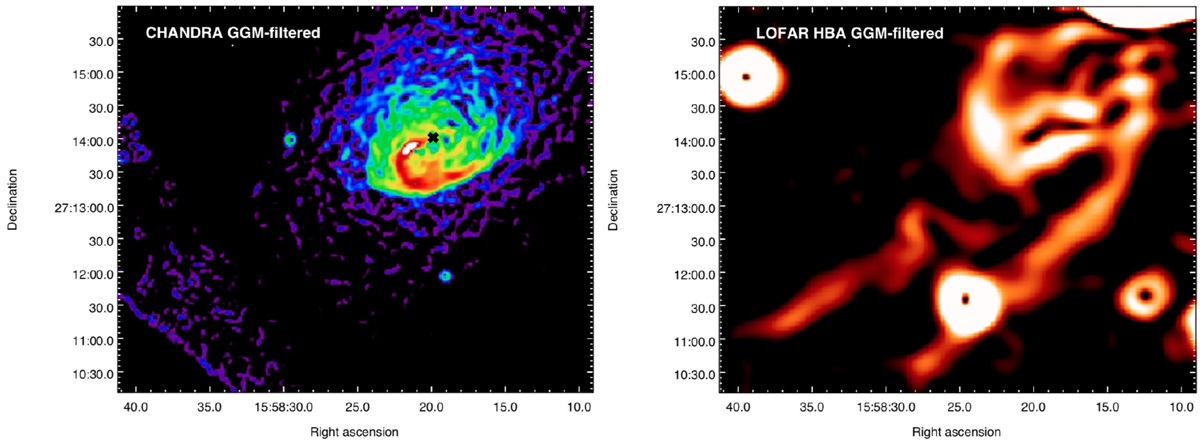
Fig. 10.
Download original image
GGM-filtered images of A2142. Discrete sources were not subtracted and appear as ring structures due to GGM-filtering. Left panel: Chandra X-ray flux image filtered with σGGM = 3″. The black cross marks the location of the BCG. The emission visible in the lower left corner is artificial and associated with the ACIS chip boundaries. Right panel: LOFAR HBA radio image filtered with σGGM = 12″. The radio emission of H1 follows the spiral pattern of the X-ray cold fronts.
Current usage metrics show cumulative count of Article Views (full-text article views including HTML views, PDF and ePub downloads, according to the available data) and Abstracts Views on Vision4Press platform.
Data correspond to usage on the plateform after 2015. The current usage metrics is available 48-96 hours after online publication and is updated daily on week days.
Initial download of the metrics may take a while.