Fig. 8
Download original image
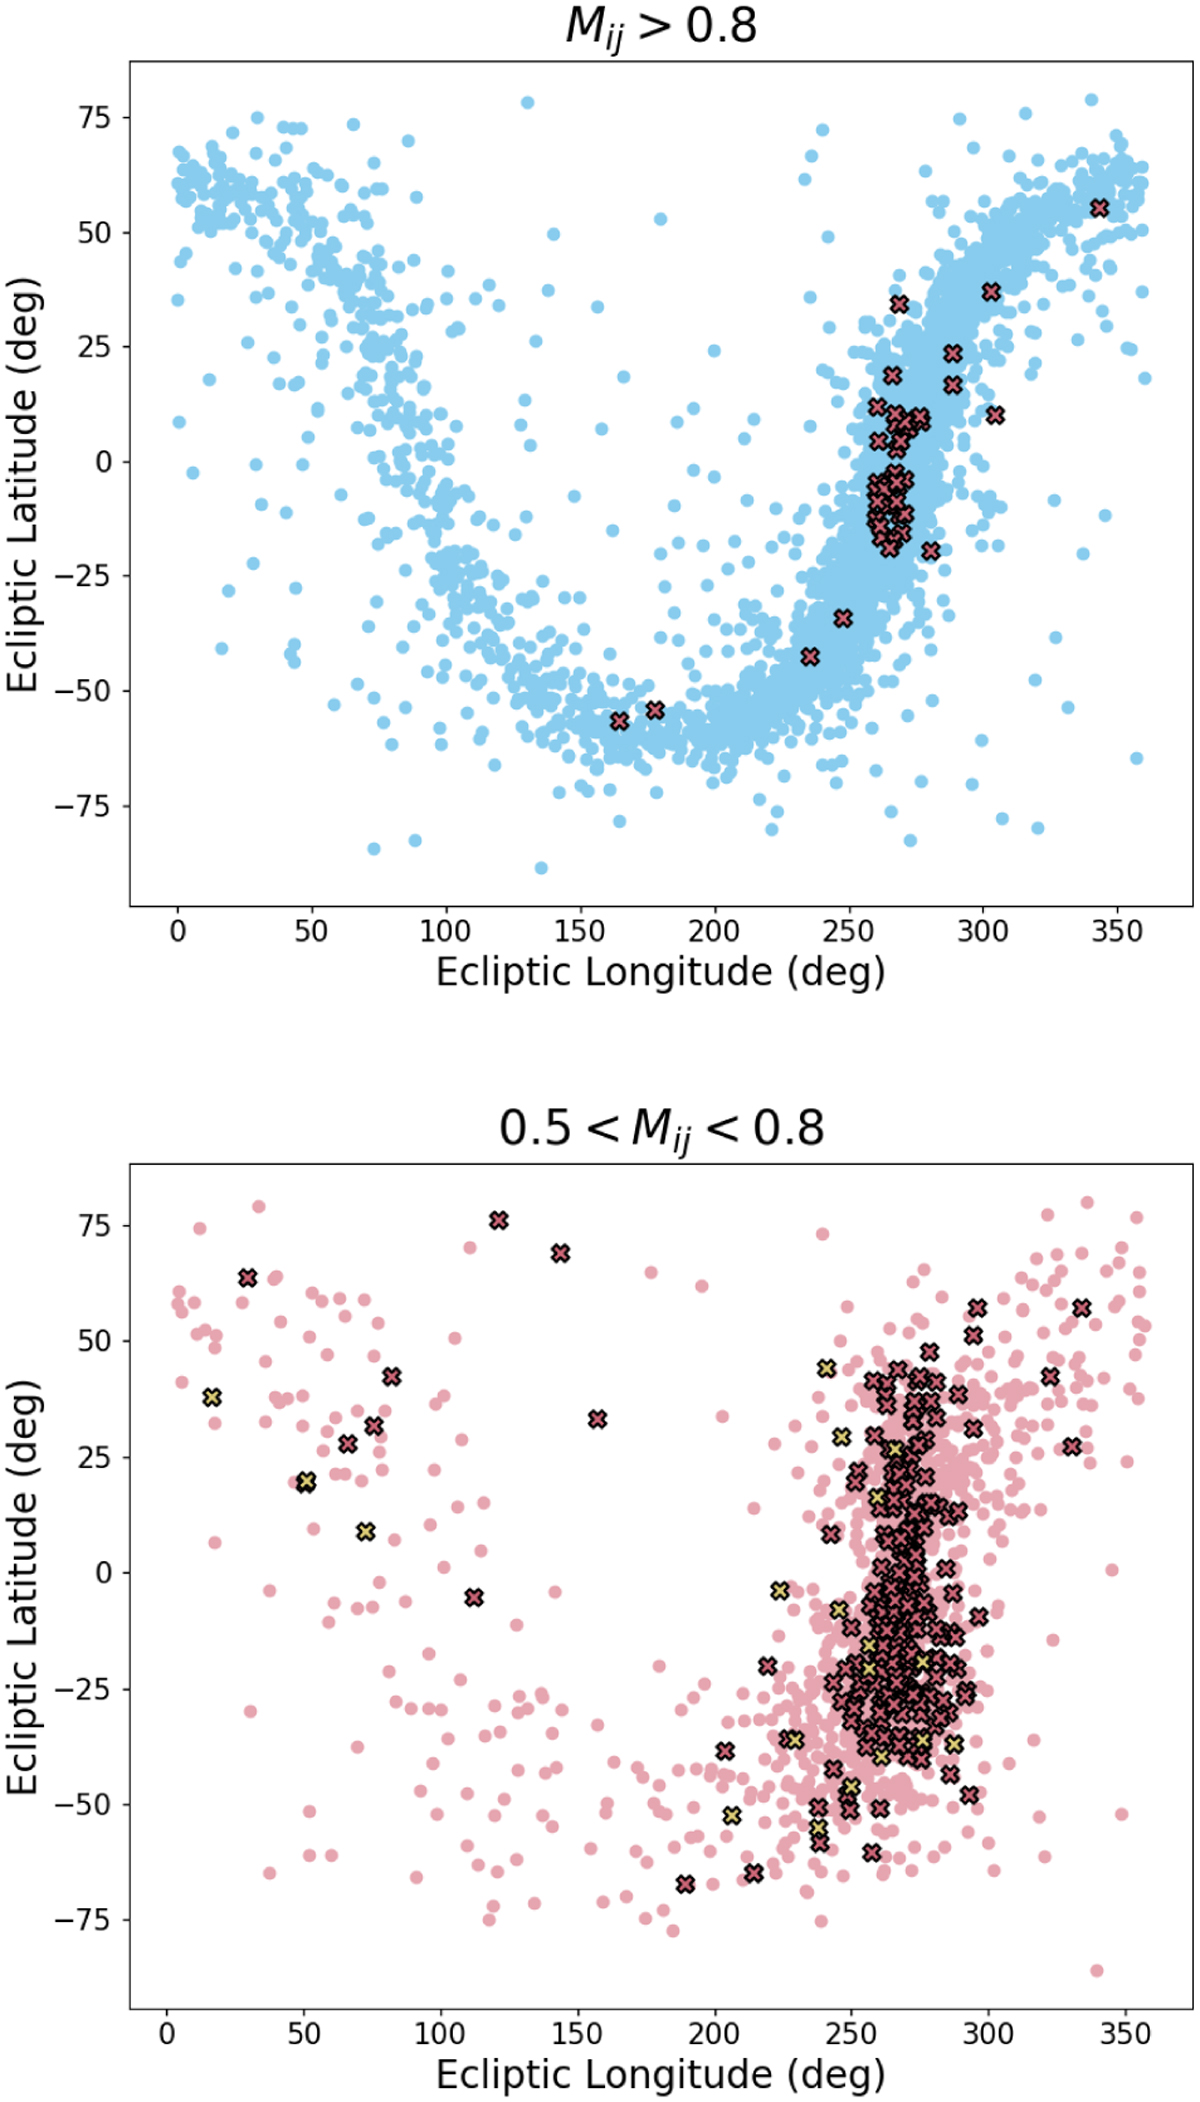
Sky location of blended 12-month catalogue UCBs. In the top and bottom graphs, the sky location of blended 12-month catalogue UCBs are highlighted here as dark pink and yellow crosses with a black border. The underlying distribution of points are all catalogue UCBs meeting a certain correlation threshold. This threshold is Mij > 0 8 in the top, and the range of 0 5 < Mij < 0 8 is used in the bottom graph. The highest concentration of points is near the galactic centre. The overlapping dark pink markers represent catalogue UCBs that have a match with more than one injection (the second type of blending described in Sect. 4). Each of the, more sparse, yellow markers represent a catalogue UCB that fits the same injection as another catalogue UCB (the first type of blending described in Sect. 4). For Mij > 0.8, the first type of blending is absent in the 12-month catalogue. One can see that most of the blended catalogue UCBs are near the galactic centre.
Current usage metrics show cumulative count of Article Views (full-text article views including HTML views, PDF and ePub downloads, according to the available data) and Abstracts Views on Vision4Press platform.
Data correspond to usage on the plateform after 2015. The current usage metrics is available 48-96 hours after online publication and is updated daily on week days.
Initial download of the metrics may take a while.