Open Access
Fig. 4
Download original image
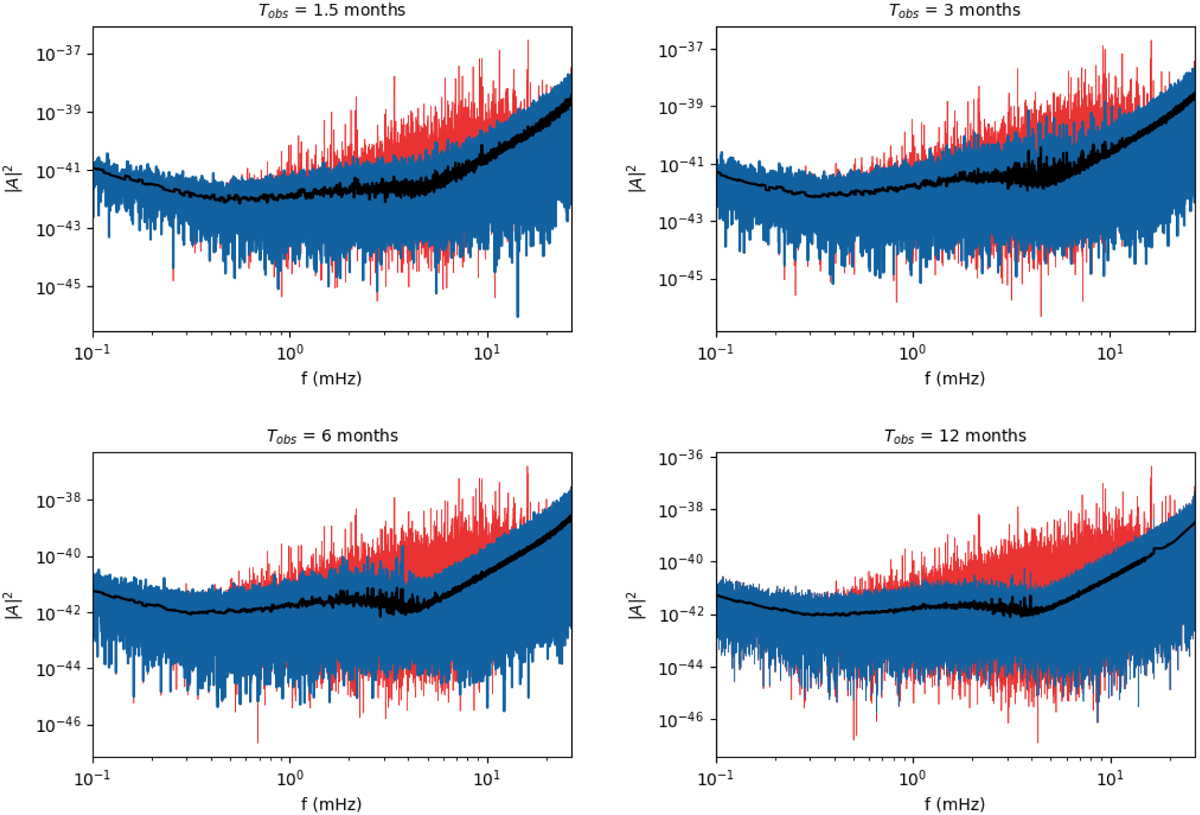
Power spectra graphs for the analysed LISA band, for the 1.5-, 3-, 6-, and 12-month catalogue. The red curve is the A-channel input data, and the dashed, blue curve is the residual, after the catalogue UCBs have been subtracted. The black curve plotted on top of the data and residual is the noise level.
Current usage metrics show cumulative count of Article Views (full-text article views including HTML views, PDF and ePub downloads, according to the available data) and Abstracts Views on Vision4Press platform.
Data correspond to usage on the plateform after 2015. The current usage metrics is available 48-96 hours after online publication and is updated daily on week days.
Initial download of the metrics may take a while.