Fig. 3
Download original image
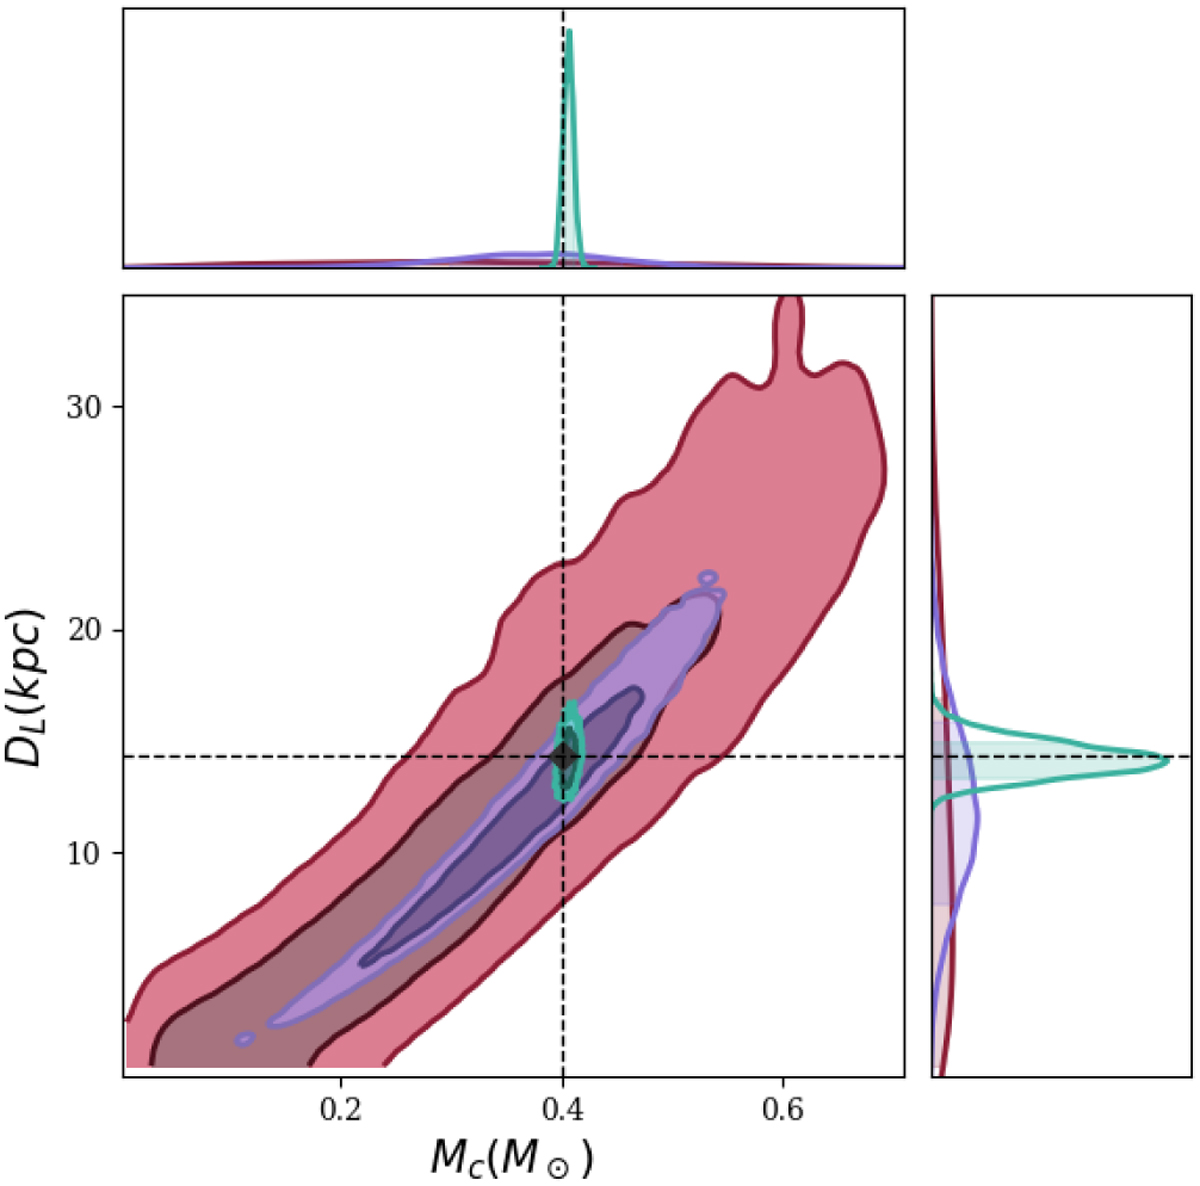
Luminosity distance and chirp mass for a well-localised, eclipsing and chirping UCB. The 12-month posteriors f and A the binary from Fig. 2 were re-sampled using Eq. (2) to form the luminosity distance DL and chirp mass M⊙ posteriors. The black marker on the graph corresponds to the DL and Mc derived by substituting the injected LDC parameters into Eq. (2). See Fig. 2 for a description of the three colours.
Current usage metrics show cumulative count of Article Views (full-text article views including HTML views, PDF and ePub downloads, according to the available data) and Abstracts Views on Vision4Press platform.
Data correspond to usage on the plateform after 2015. The current usage metrics is available 48-96 hours after online publication and is updated daily on week days.
Initial download of the metrics may take a while.