Fig. A.2
Download original image
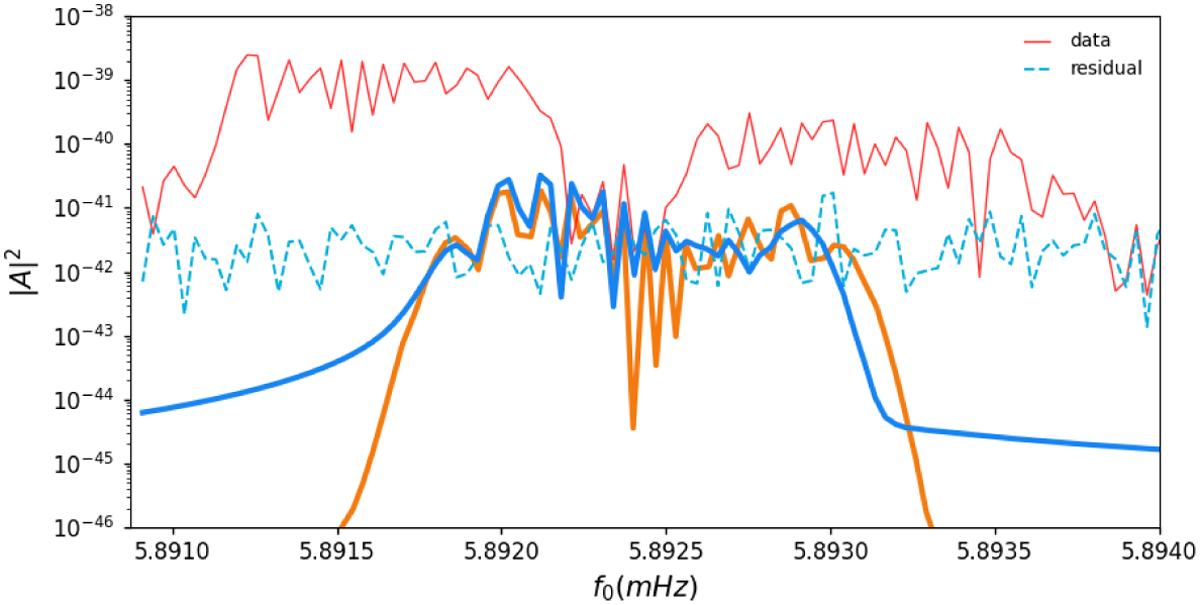
The PSD for corner case 1. The A-channel power spectral density of the sum of confused catalogue UCB waveforms (LDC0058924130+LDC0058923825) is in orange, and the LDC injected waveform (INJ005892423) that matches with the summed catalogue waveforms is the solid blue curve. The original data are in red, and residual is plot as a dashed blue curve. One can see from the red curve that there are at least two high S/N UCBs on either side of the graphed waveforms. Except for INJ005892423, all injected waveforms have been recovered.
Current usage metrics show cumulative count of Article Views (full-text article views including HTML views, PDF and ePub downloads, according to the available data) and Abstracts Views on Vision4Press platform.
Data correspond to usage on the plateform after 2015. The current usage metrics is available 48-96 hours after online publication and is updated daily on week days.
Initial download of the metrics may take a while.