Fig. 1
Download original image
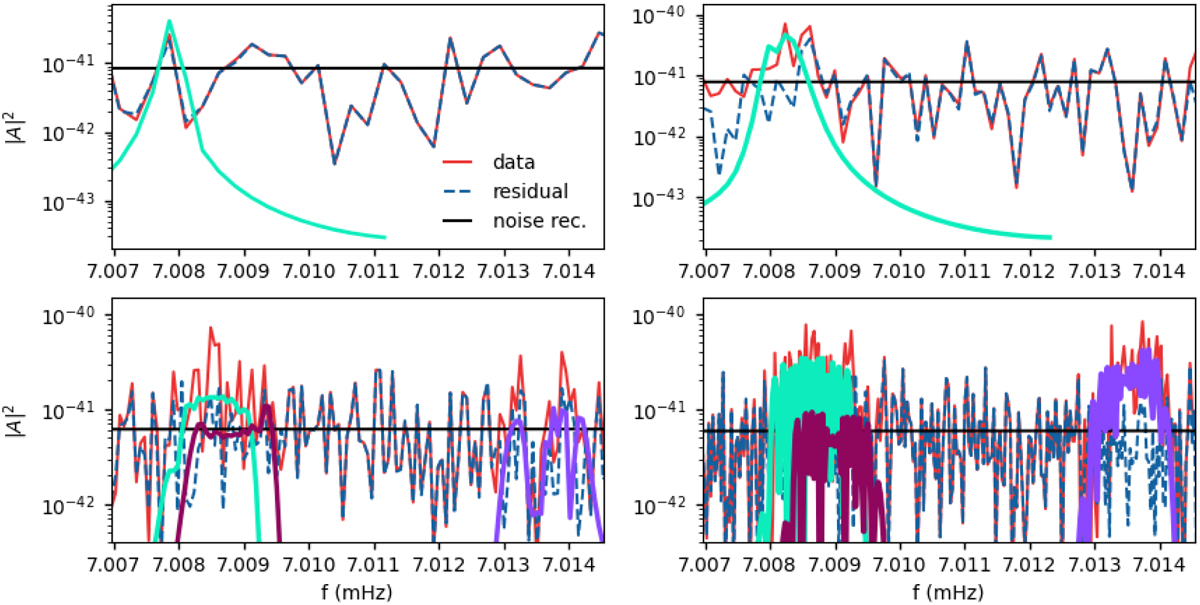
Waveform evolution as a function of observing time. Individual waveforms are plotted over the input A-channel PSD (solid, red curve), noise (constant, black curve stretching across the frequency window) and residual (dashed, blue curve) curves. The top graphs show a single 1.5-month (left panel) and 3-month (right panel) catalogue waveform, in green. The bottom panels show, in total, three 6- and 12-month catalogue waveforms, two of which did not appear in any earlier catalogue. All injected signals in this frequency window were recovered in a 6- and 12-month analysis.
Current usage metrics show cumulative count of Article Views (full-text article views including HTML views, PDF and ePub downloads, according to the available data) and Abstracts Views on Vision4Press platform.
Data correspond to usage on the plateform after 2015. The current usage metrics is available 48-96 hours after online publication and is updated daily on week days.
Initial download of the metrics may take a while.