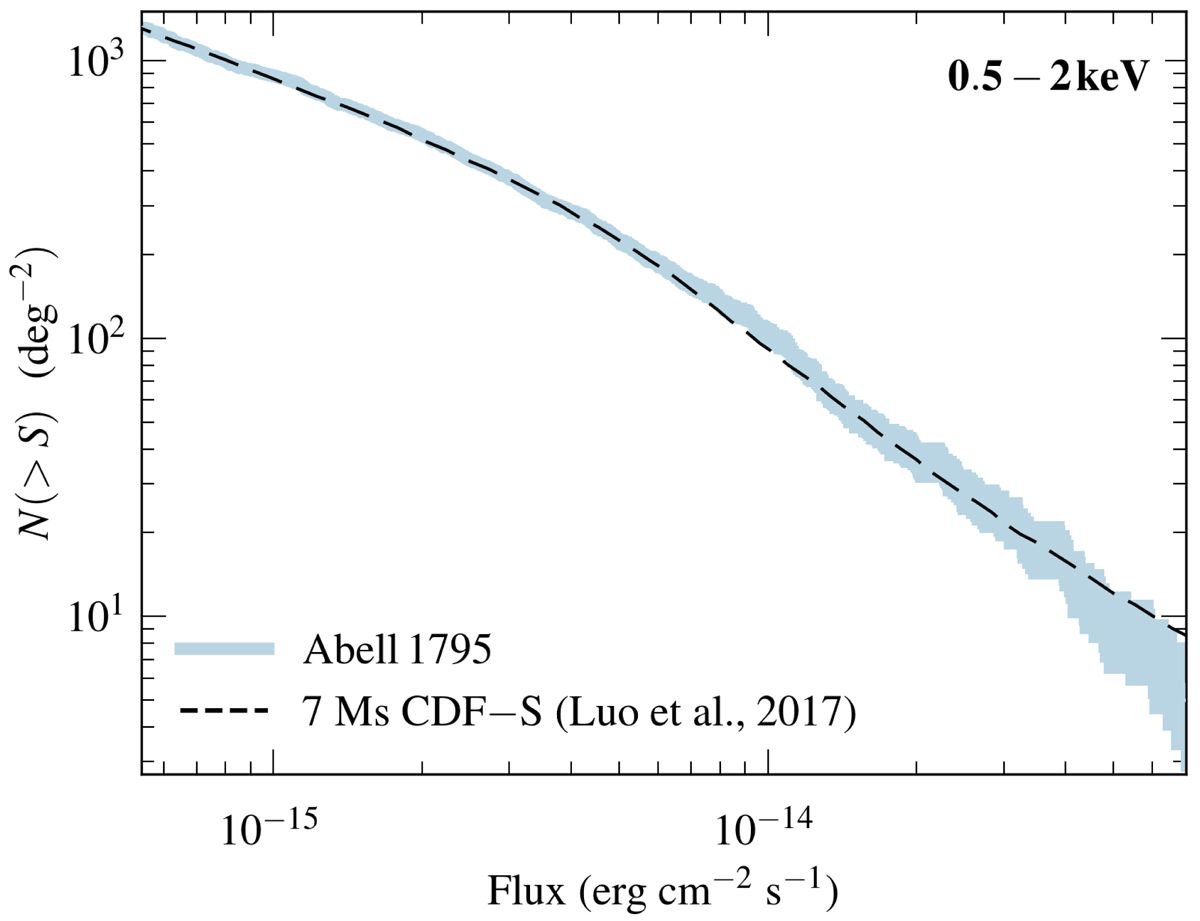
Fig. 7.
Download original image
Log N − log S plot for the sources detected in the Abell 1795 field (shaded curve with 1σ uncertainty) and in the 7 Ms Chandra Deep Field South (Luo et al. 2017). Despite the excess in the number of Abell 1795 field sources seen at ∼10−14 erg cm−2 s−1, which can be attributed to the cosmic variance, the distributions are in good agreement at fluxes below ∼6 × 10⁻¹⁴ erg cm−2 s−1. No excess can be explicitly attributed to unidentified clumps among wavdetect sources.
Current usage metrics show cumulative count of Article Views (full-text article views including HTML views, PDF and ePub downloads, according to the available data) and Abstracts Views on Vision4Press platform.
Data correspond to usage on the plateform after 2015. The current usage metrics is available 48-96 hours after online publication and is updated daily on week days.
Initial download of the metrics may take a while.