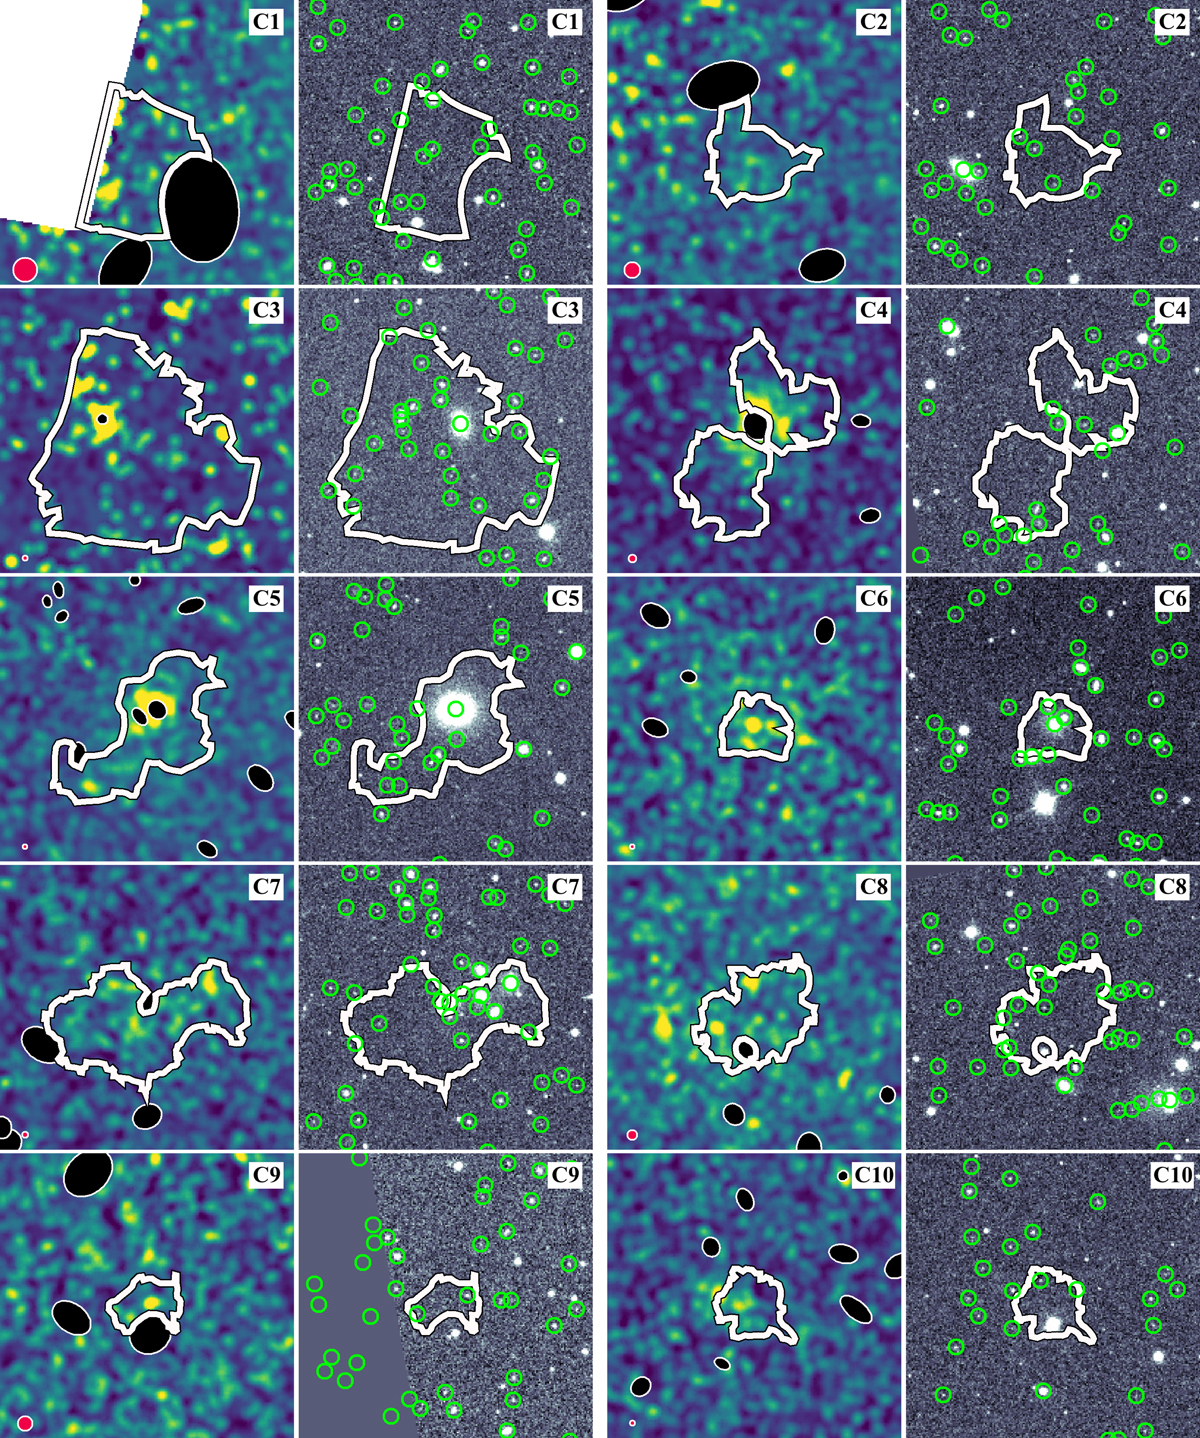
Fig. 4.
Download original image
Chandra 0.7 − 2 keV (left panel, color images) and SDSS r-band cutout images (right panel, greyscale images) showing the individual clump candidates (white, irregular-shaped regions) and their environment within a 200″ × 200″ area. The Chandra images are smoothed with a Gaussian of a radius of 6 to accentuate the X-ray excess. Filled black ellipses represent excluded wavdetect sources, while the filled red circle at the bottom left of each Chandra image marks the local minimum size of PSF. As most of the clump candidates overlap with multiple SDSS galaxies (green circles), possible physical connections must be addressed to isolate genuine clumps (Sects. 3.1.1 and Appendix A).
Current usage metrics show cumulative count of Article Views (full-text article views including HTML views, PDF and ePub downloads, according to the available data) and Abstracts Views on Vision4Press platform.
Data correspond to usage on the plateform after 2015. The current usage metrics is available 48-96 hours after online publication and is updated daily on week days.
Initial download of the metrics may take a while.