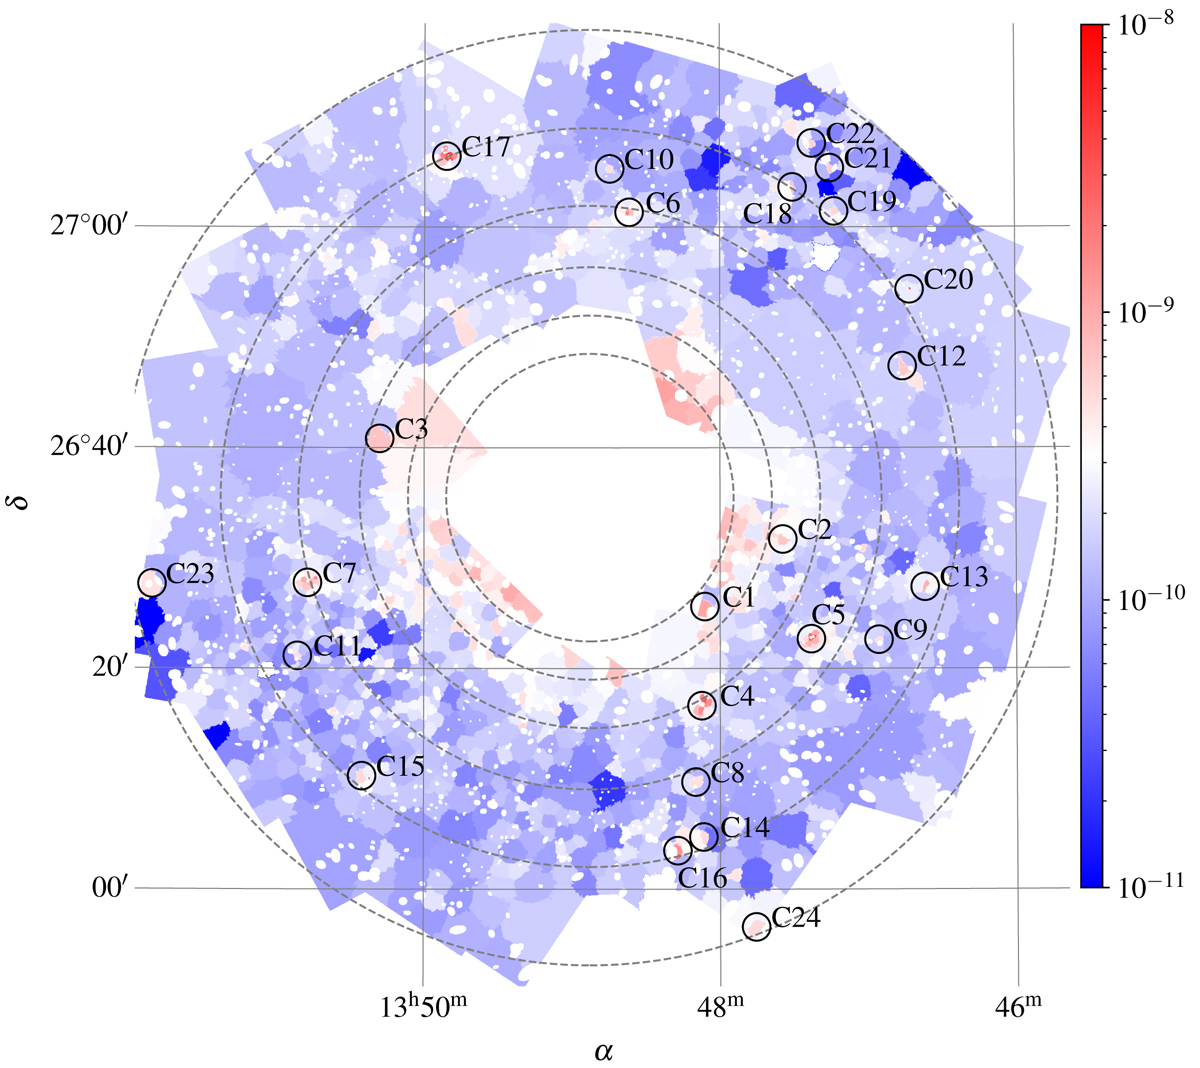
Fig. 2.
Download original image
Adaptively binned image of Abell 1795 outskirts in the 0.7 − 2 keV energy band. The image is instrumental background- and exposure-corrected. Each bin has a S/N of ≳3, and a surface brightness value indicated by the colorbar in photon cm−2 s−1 pixel−1 units. Small white ellipses scattered throughout the field represent excluded point sources. We used this image to measure the surface brightness distribution within each annulus (dashed-line circles) and to isolate outliers that may originate from ICM inhomogeneities. Outlier positions are shown with small circles marked from C1 to C24 (for the actual size and shape of the outliers, see Fig. 4).
Current usage metrics show cumulative count of Article Views (full-text article views including HTML views, PDF and ePub downloads, according to the available data) and Abstracts Views on Vision4Press platform.
Data correspond to usage on the plateform after 2015. The current usage metrics is available 48-96 hours after online publication and is updated daily on week days.
Initial download of the metrics may take a while.