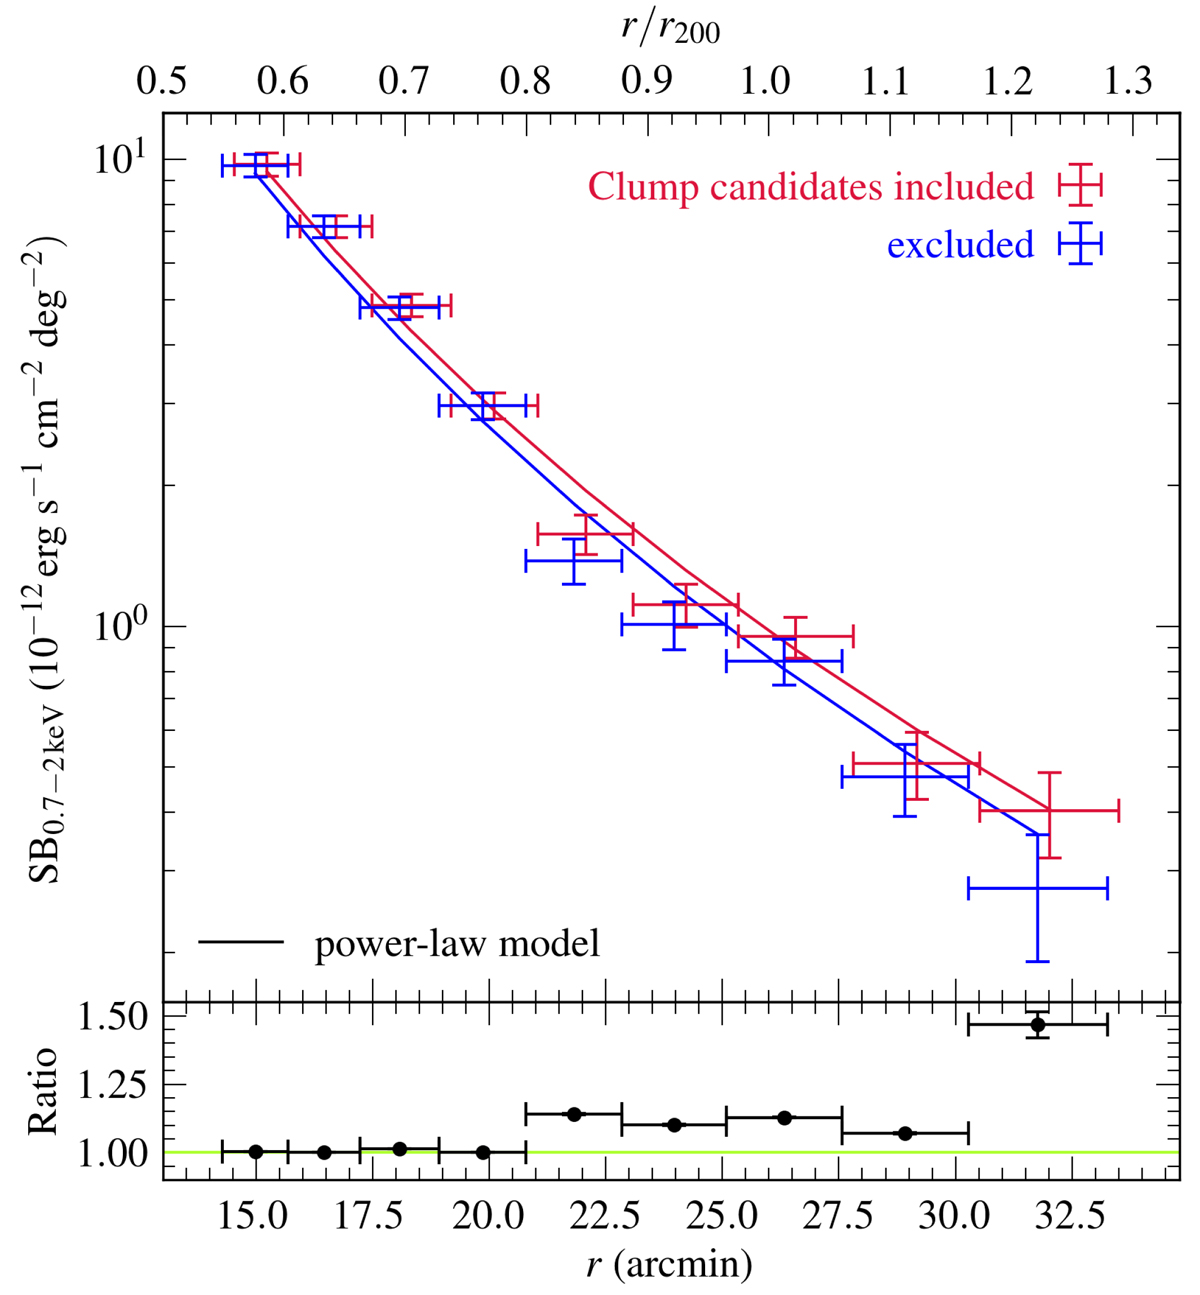
Fig. 11.
Download original image
Azimuthally averaged surface brightness profile of Abell 1795 from Chandra data with clump candidates included and excluded. The bottom panel shows the difference, where a slight decrement in the profile at the radius of the clump candidates becomes prominent when removing these sources. The best-fit power-law also becomes moderately steeper with the 24 clump candidates removed, with the best-fit α increasing from 4.18 ± 0.13 to 4.34 ± 0.09. This steepening, however, is attributed mainly to the relatively large difference between the last data points and the associated uncertainties.
Current usage metrics show cumulative count of Article Views (full-text article views including HTML views, PDF and ePub downloads, according to the available data) and Abstracts Views on Vision4Press platform.
Data correspond to usage on the plateform after 2015. The current usage metrics is available 48-96 hours after online publication and is updated daily on week days.
Initial download of the metrics may take a while.