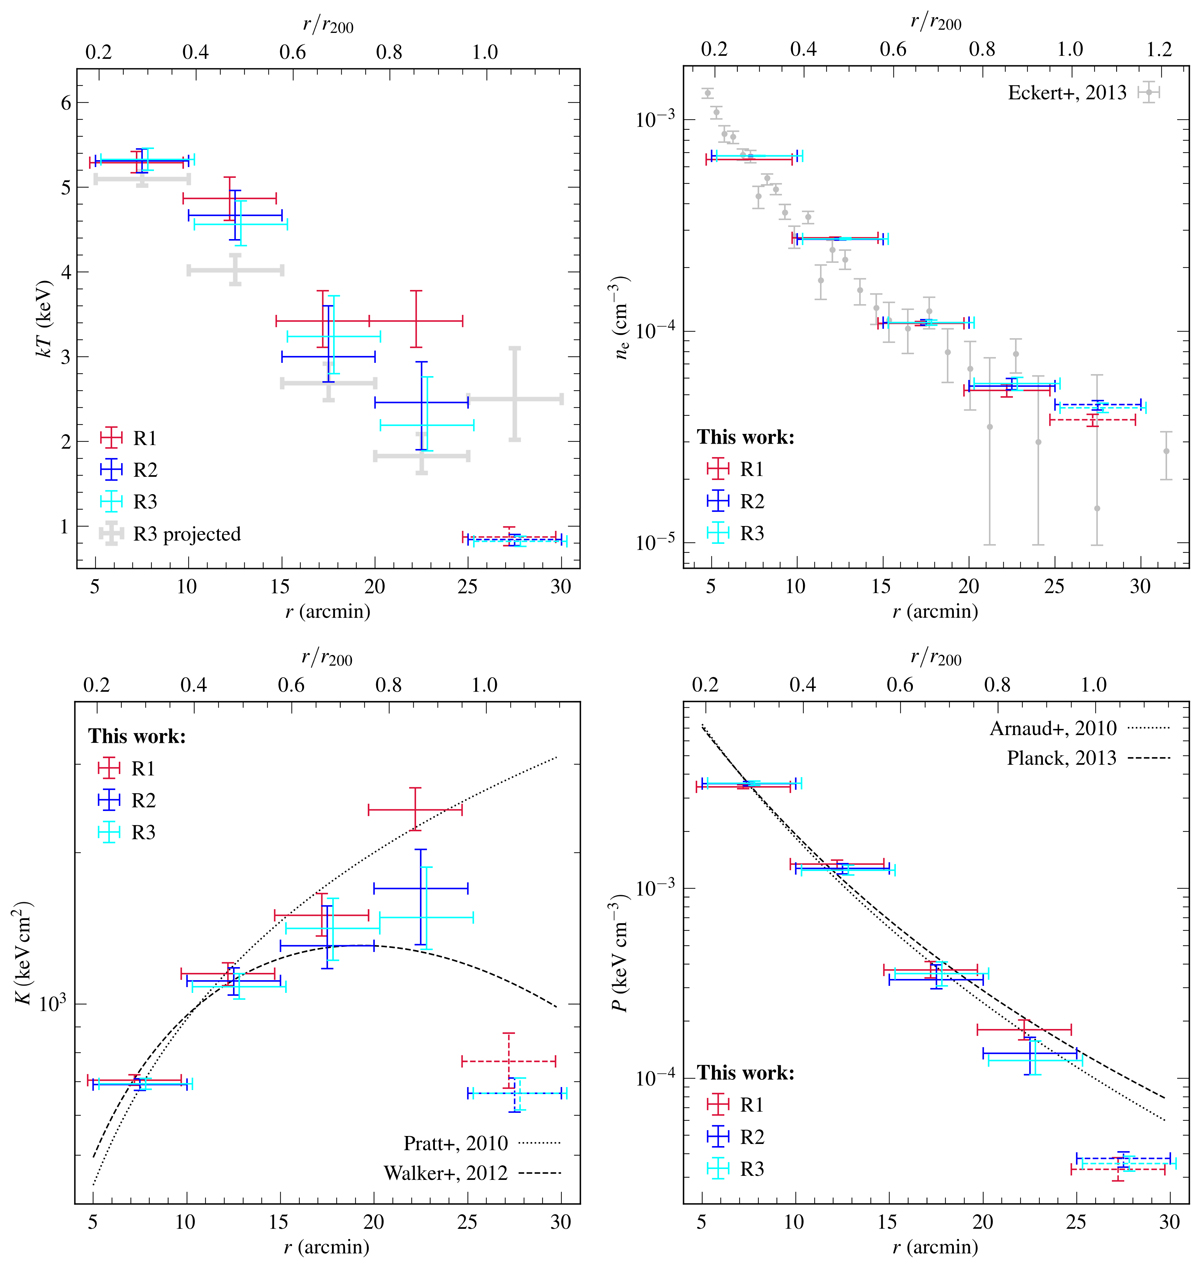
Fig. 9.
Download original image
Deprojected profiles of the cluster outskirts with R1−3 denoting the deprojected equivalents of the profiles shown in Fig. 8 (Sect. 2.2.2). The outermost data points, shown with dashed lines, exhibit large uncertainties introduced with the deprojection. Top left: comparison between the deprojected and the projected temperature profiles. Top right: electron density profiles overplotted with ROSAT measurements of the same cluster by Eckert et al. (2013). Bottom left: entropy profiles compared with the profile of Pratt et al. (2010), which models a galaxy cluster formed by gravitational collapse with no additional heating or cooling and with the analytic function of Walker et al. (2012) fitted on a sample of Suzaku observed clusters. Bottom right: pressure profile overplotted with the best-fit models of Arnaud et al. (2010) and the Planck Collaboration Int. V (2013).
Current usage metrics show cumulative count of Article Views (full-text article views including HTML views, PDF and ePub downloads, according to the available data) and Abstracts Views on Vision4Press platform.
Data correspond to usage on the plateform after 2015. The current usage metrics is available 48-96 hours after online publication and is updated daily on week days.
Initial download of the metrics may take a while.