Open Access
Fig. 5.
Download original image
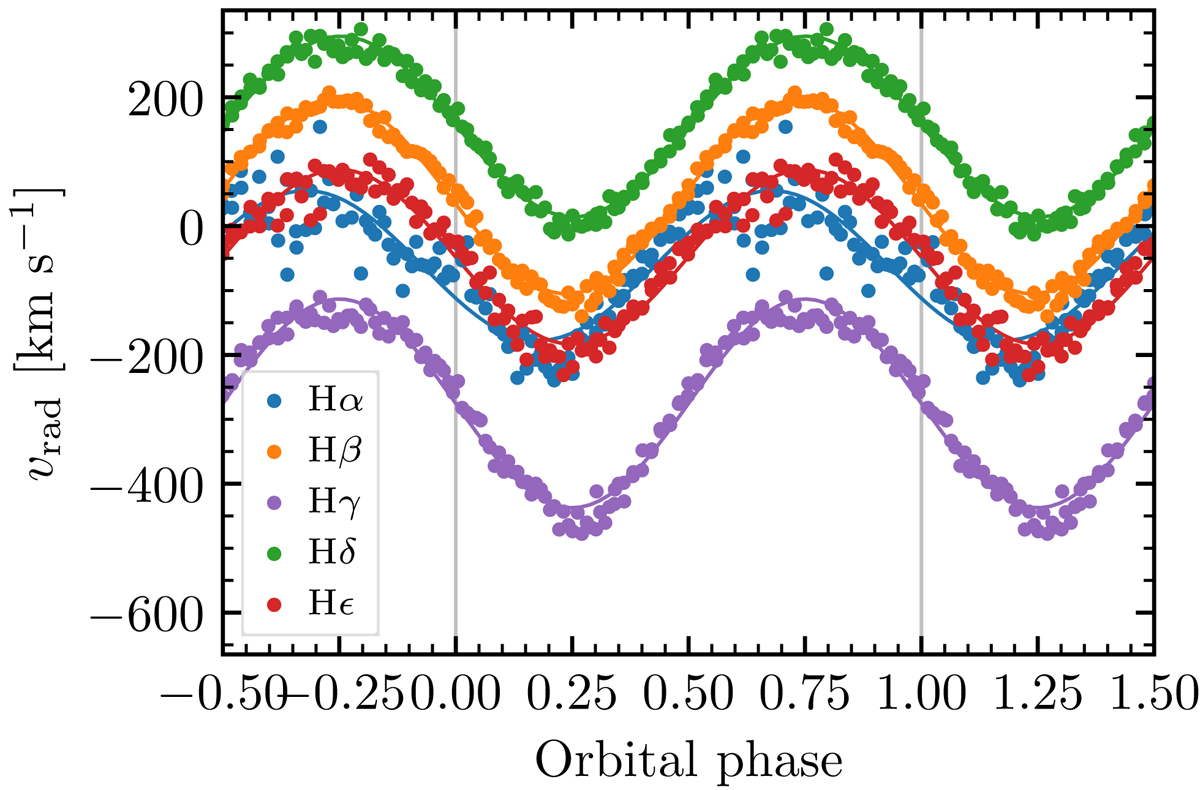
Radial velocity curves of absorption components of Balmer lines observed in the 2019 HARPS spectra. The solid lines show the best fitting models to the radial velocity curves, and the best fitting parameters are given in Table 2.
Current usage metrics show cumulative count of Article Views (full-text article views including HTML views, PDF and ePub downloads, according to the available data) and Abstracts Views on Vision4Press platform.
Data correspond to usage on the plateform after 2015. The current usage metrics is available 48-96 hours after online publication and is updated daily on week days.
Initial download of the metrics may take a while.