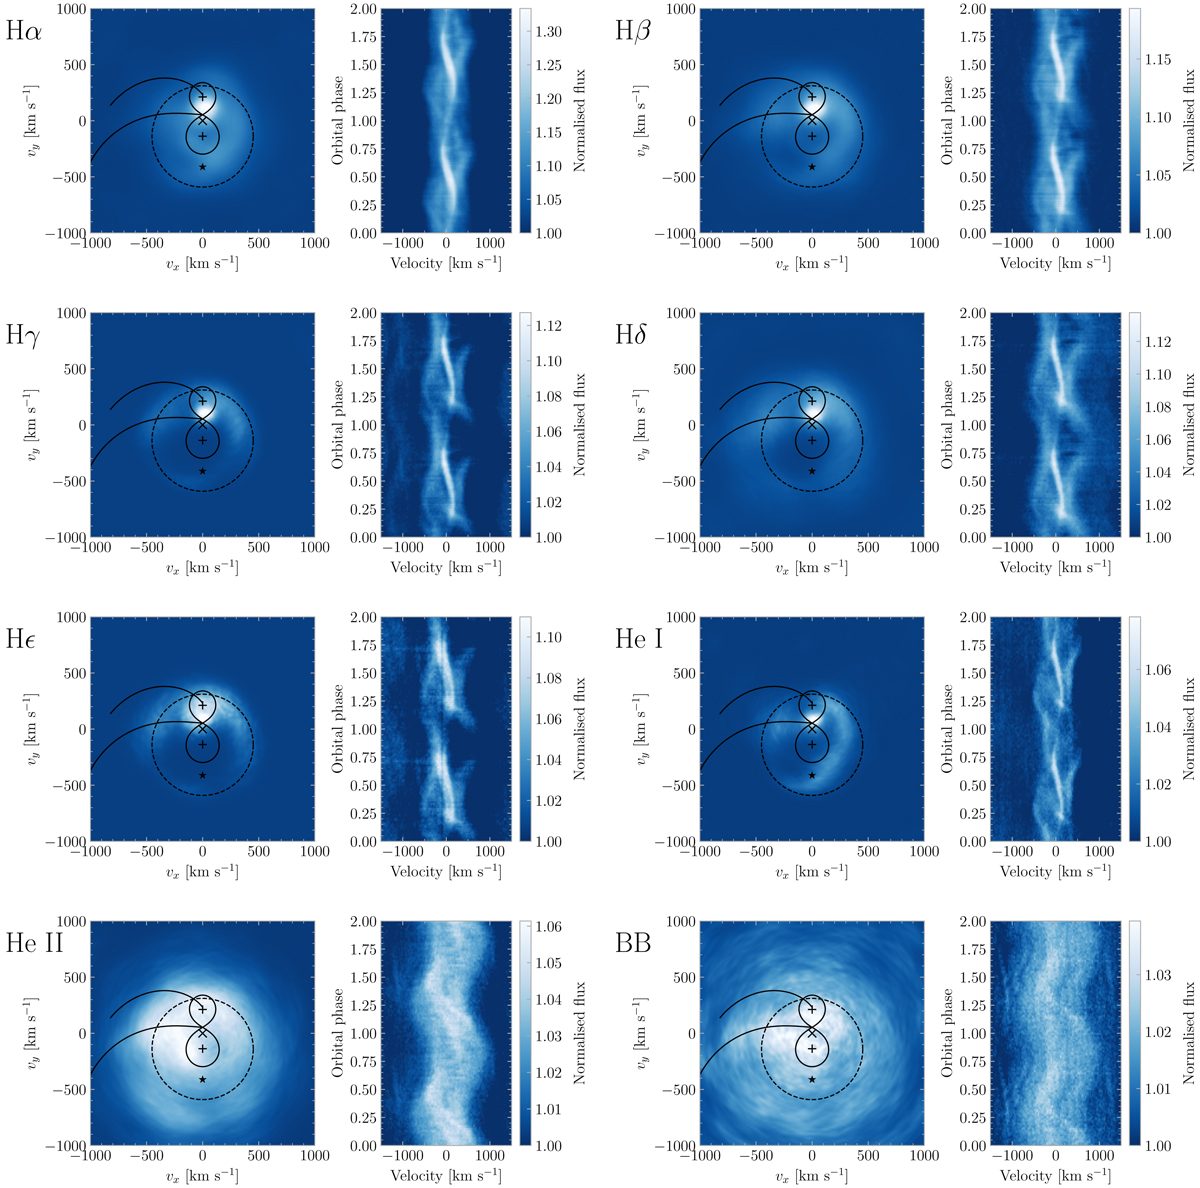
Fig. 10.
Download original image
Doppler tomography based on HARPS observations from all three nights. The colour of the Doppler maps corresponds to arbitrary units of emission intensity. The positions of the primary and secondary are given by plus signs, the centre of mass by the cross, and the position of the L3 point by the star. The velocity of the L3 point corresponds to its velocity caused by the rotation of the binary system; the Keplerian velocity of the disc extrapolated to this location is greater by about 40 km s−1. Roche lobes of both components and the expected stream trajectory are outlined by solid lines, the tidal limitation radius is outlined by the dashed circle. The Doppler maps were computed from lines Hα, Hβ, Hγ, Hδ, Hε, He Iλ6677 Å, He IIλ4686 Å and from the Bowen blend (BB). All maps derived from the analysis of the Balmer lines are corrected for the presence of the absorption features, as described in Sect. 4.1. For each map a trailed spectrum of the corresponding line is shown. The scale of the Doppler maps was chosen to highlight the observed structures and does not correspond to the scale of trailed spectra. Figure A.1 shows the same Doppler maps, only in inverse hyperbolic sine scale, in which the low-amplitude features are highlighted.
Current usage metrics show cumulative count of Article Views (full-text article views including HTML views, PDF and ePub downloads, according to the available data) and Abstracts Views on Vision4Press platform.
Data correspond to usage on the plateform after 2015. The current usage metrics is available 48-96 hours after online publication and is updated daily on week days.
Initial download of the metrics may take a while.