Open Access
Fig. 6.
Download original image
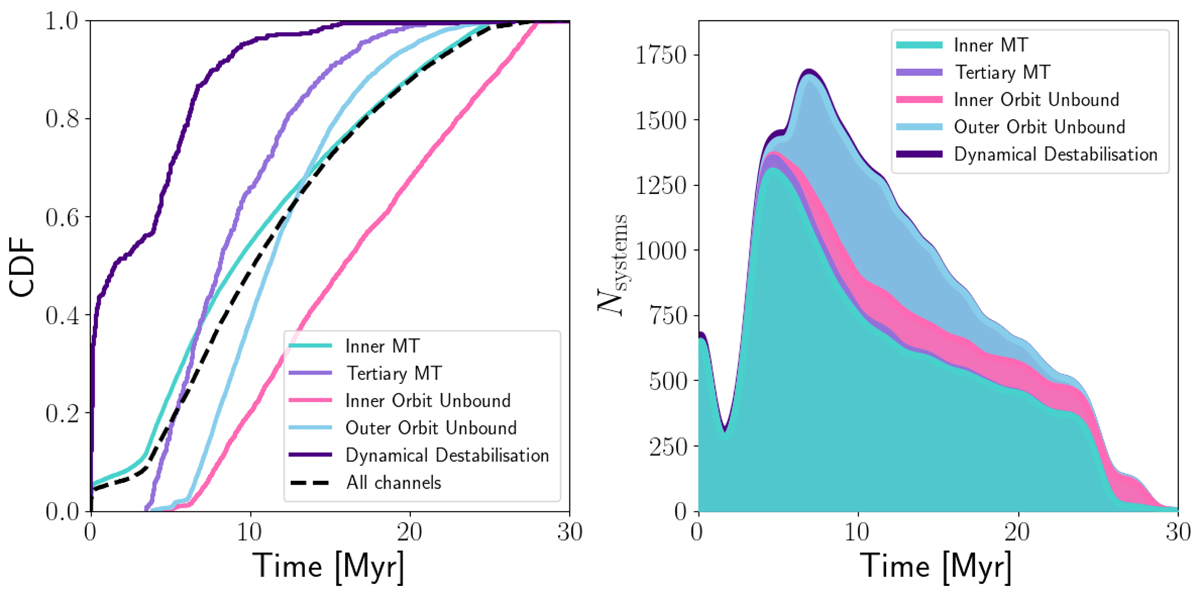
Rate of interactions as a function of time for the fiducial model. Left: Cumulative normalised distribution per evolutionary channel. The black dashed line combines the contribution of all channels. Right: Total number of interactions occurring at each moment in time, summed across all channels.
Current usage metrics show cumulative count of Article Views (full-text article views including HTML views, PDF and ePub downloads, according to the available data) and Abstracts Views on Vision4Press platform.
Data correspond to usage on the plateform after 2015. The current usage metrics is available 48-96 hours after online publication and is updated daily on week days.
Initial download of the metrics may take a while.