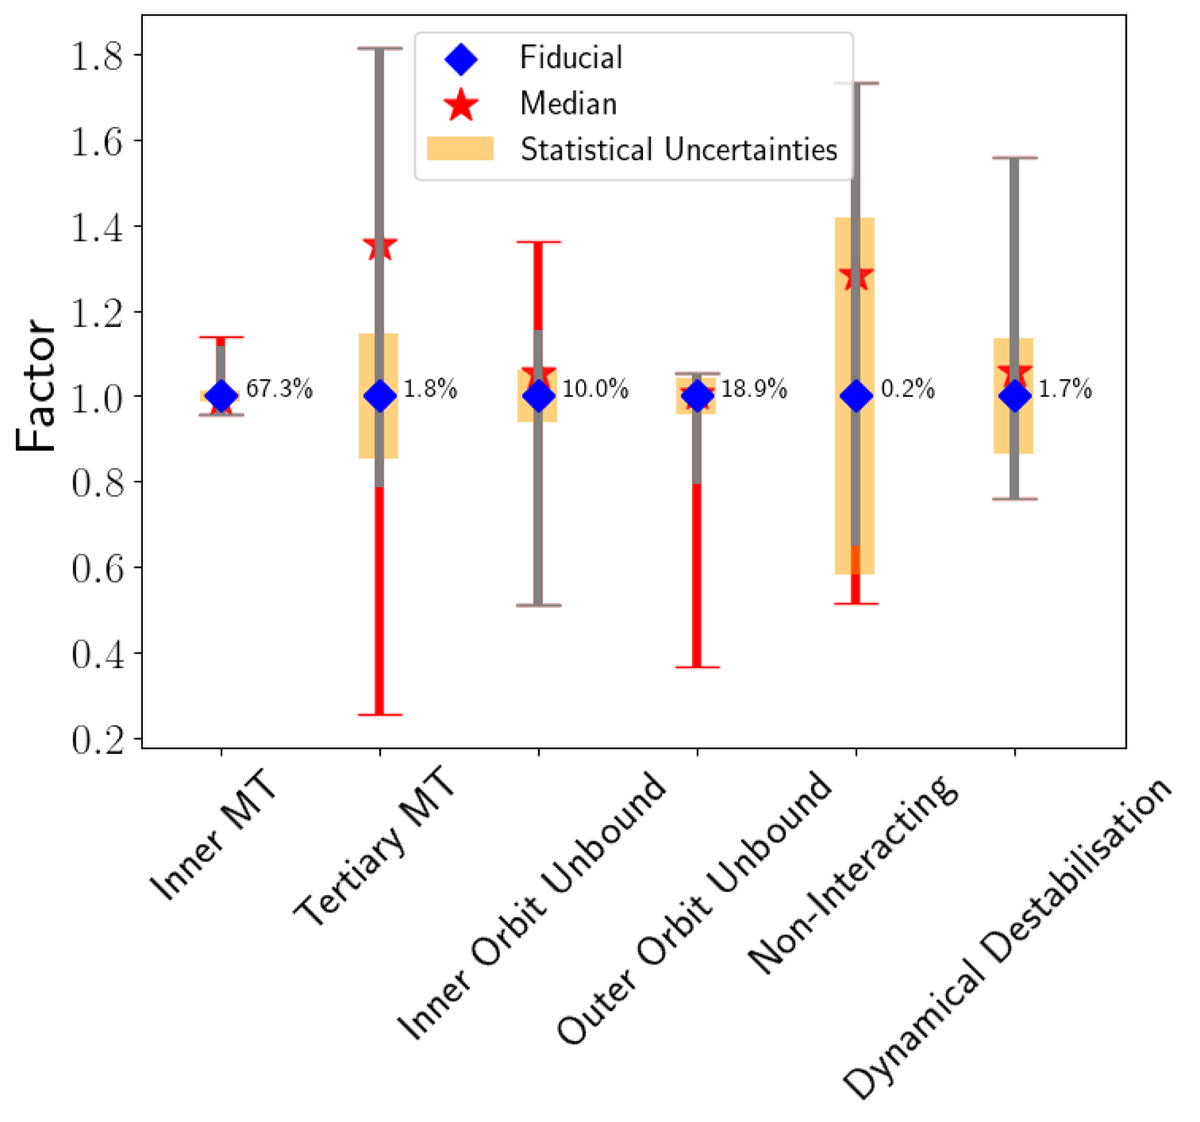
Fig. 4.
Download original image
Predicted number of systems that evolve through each evolutionary channel for all model variations with respect to the fiducial model (blue diamonds). A factor 0.5 and 2 indicate a factor two decrease and increase, respectively. The predicted rates of all model variations are combined into the median (red stars), and the largest outliers per channel are represented by the error bars. The red part of the error bars corresponds to Model qout-Moe, the model for which the predictions deviate most significantly from the fiducial model. The statistical uncertainties (3σ) on the predictions for the fiducial model are also included (orange bars). The relative contribution of each evolutionary channel for the fiducial is given as a percentage.
Current usage metrics show cumulative count of Article Views (full-text article views including HTML views, PDF and ePub downloads, according to the available data) and Abstracts Views on Vision4Press platform.
Data correspond to usage on the plateform after 2015. The current usage metrics is available 48-96 hours after online publication and is updated daily on week days.
Initial download of the metrics may take a while.