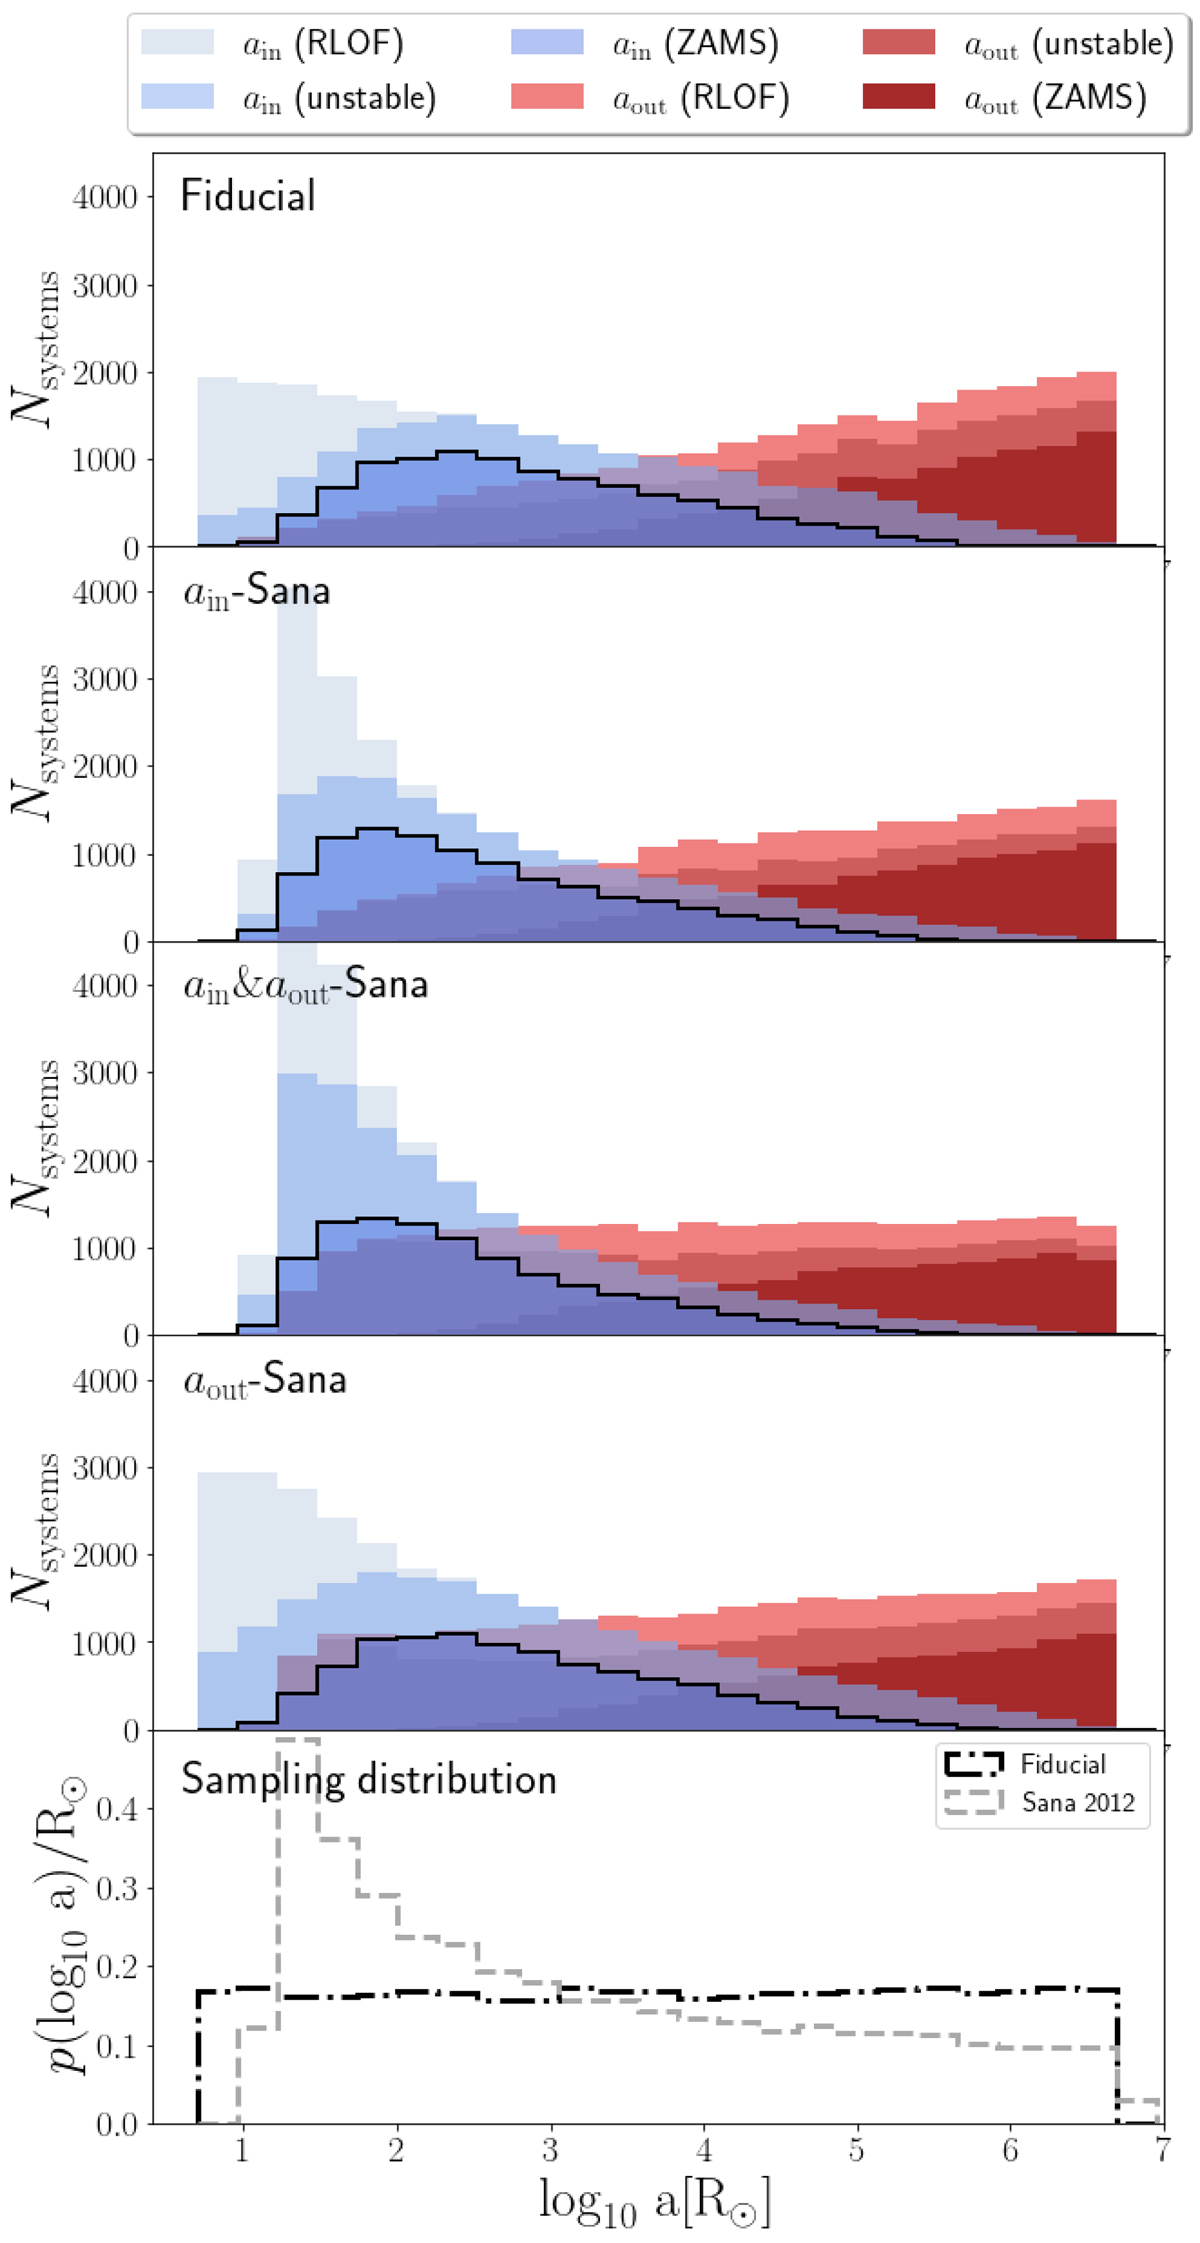
Fig. 1.
Download original image
Initial distributions of the inner- (blue) and outer (red) semi-major axis for our fiducial model and three model variations. The solid black lines represent the ZAMS population, consisting exclusively of initially stable, non-interacting hierarchical triple stars. The lighter colours correspond to the population before excluding dynamically unstable systems and systems that are Roche-lobe filling at birth. To enhance the features in the plot, we have cut off the top part of the distribution for model ain & aout-Sana. The bottom panel shows the initial sampling distributions of the fiducial model and the Sana distribution.
Current usage metrics show cumulative count of Article Views (full-text article views including HTML views, PDF and ePub downloads, according to the available data) and Abstracts Views on Vision4Press platform.
Data correspond to usage on the plateform after 2015. The current usage metrics is available 48-96 hours after online publication and is updated daily on week days.
Initial download of the metrics may take a while.