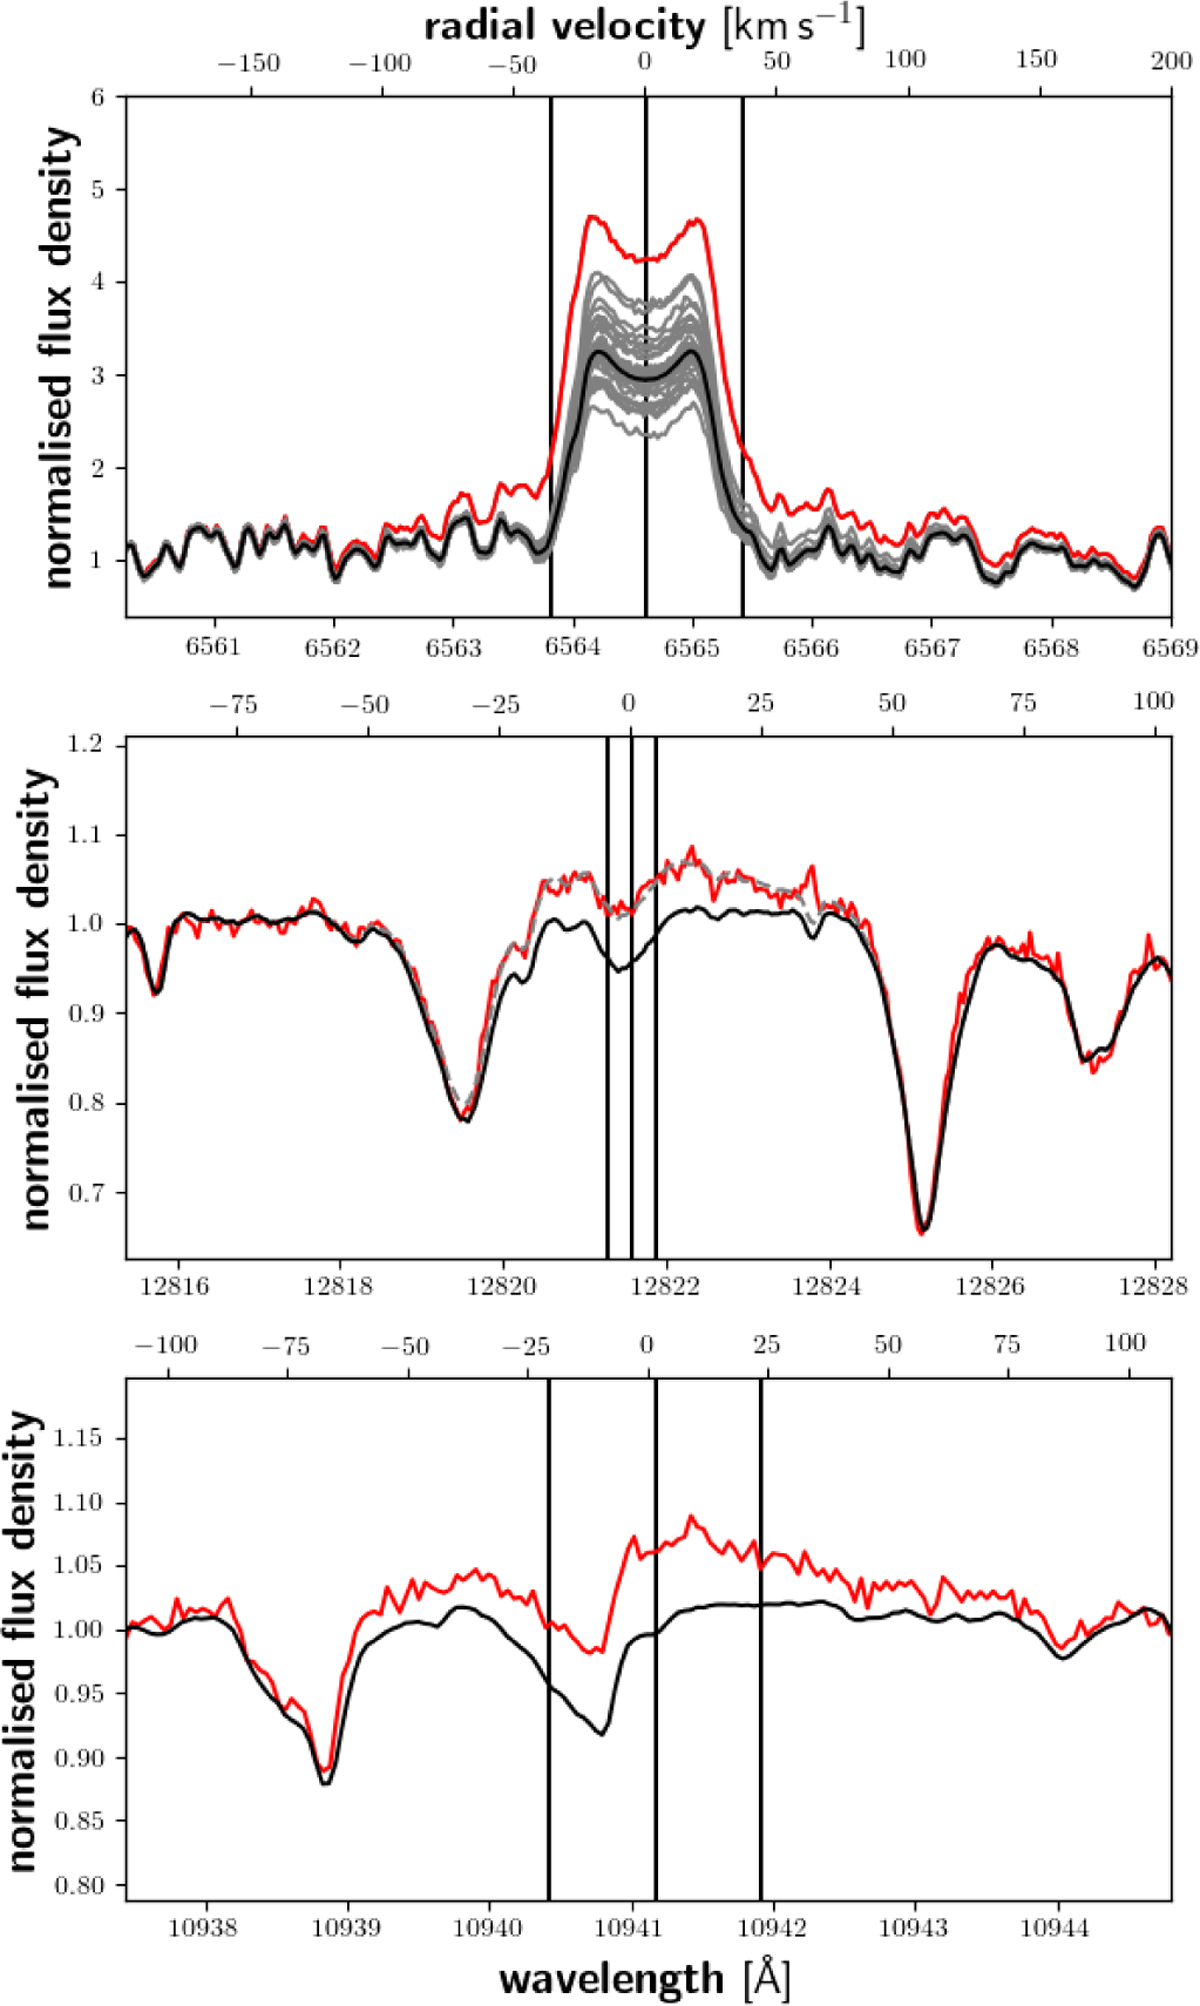
Fig. 6

Download original image
Typical example of flaring activity: the M3.5V star J07319+362N/BL Lyn. Top: The Hα line. Middle: The Paβ line. Bottom: The Paγ line. Shown are all spectra of the star in grey (only for Hα for clarity), and the median spectrum in black, while the flare spectrum is shown in red. For the Paβ line we also show as grey dashed line a Gaussian fit of the flare excess flux density. The vertical lines denote the central wavelength of the respective line and the integration ranges of the pEWs. During flares showing Paβ emission, the integration range for the Paschen lines as well as the Hα line is usually much too small and can only be used for identification of these flares. In the shown example the full width at the line footpoints exceeds 5 Å for all three shown lines. For more details, see Sects. 3.1 and 4.2.4
Current usage metrics show cumulative count of Article Views (full-text article views including HTML views, PDF and ePub downloads, according to the available data) and Abstracts Views on Vision4Press platform.
Data correspond to usage on the plateform after 2015. The current usage metrics is available 48-96 hours after online publication and is updated daily on week days.
Initial download of the metrics may take a while.


