Fig. 1

Download original image
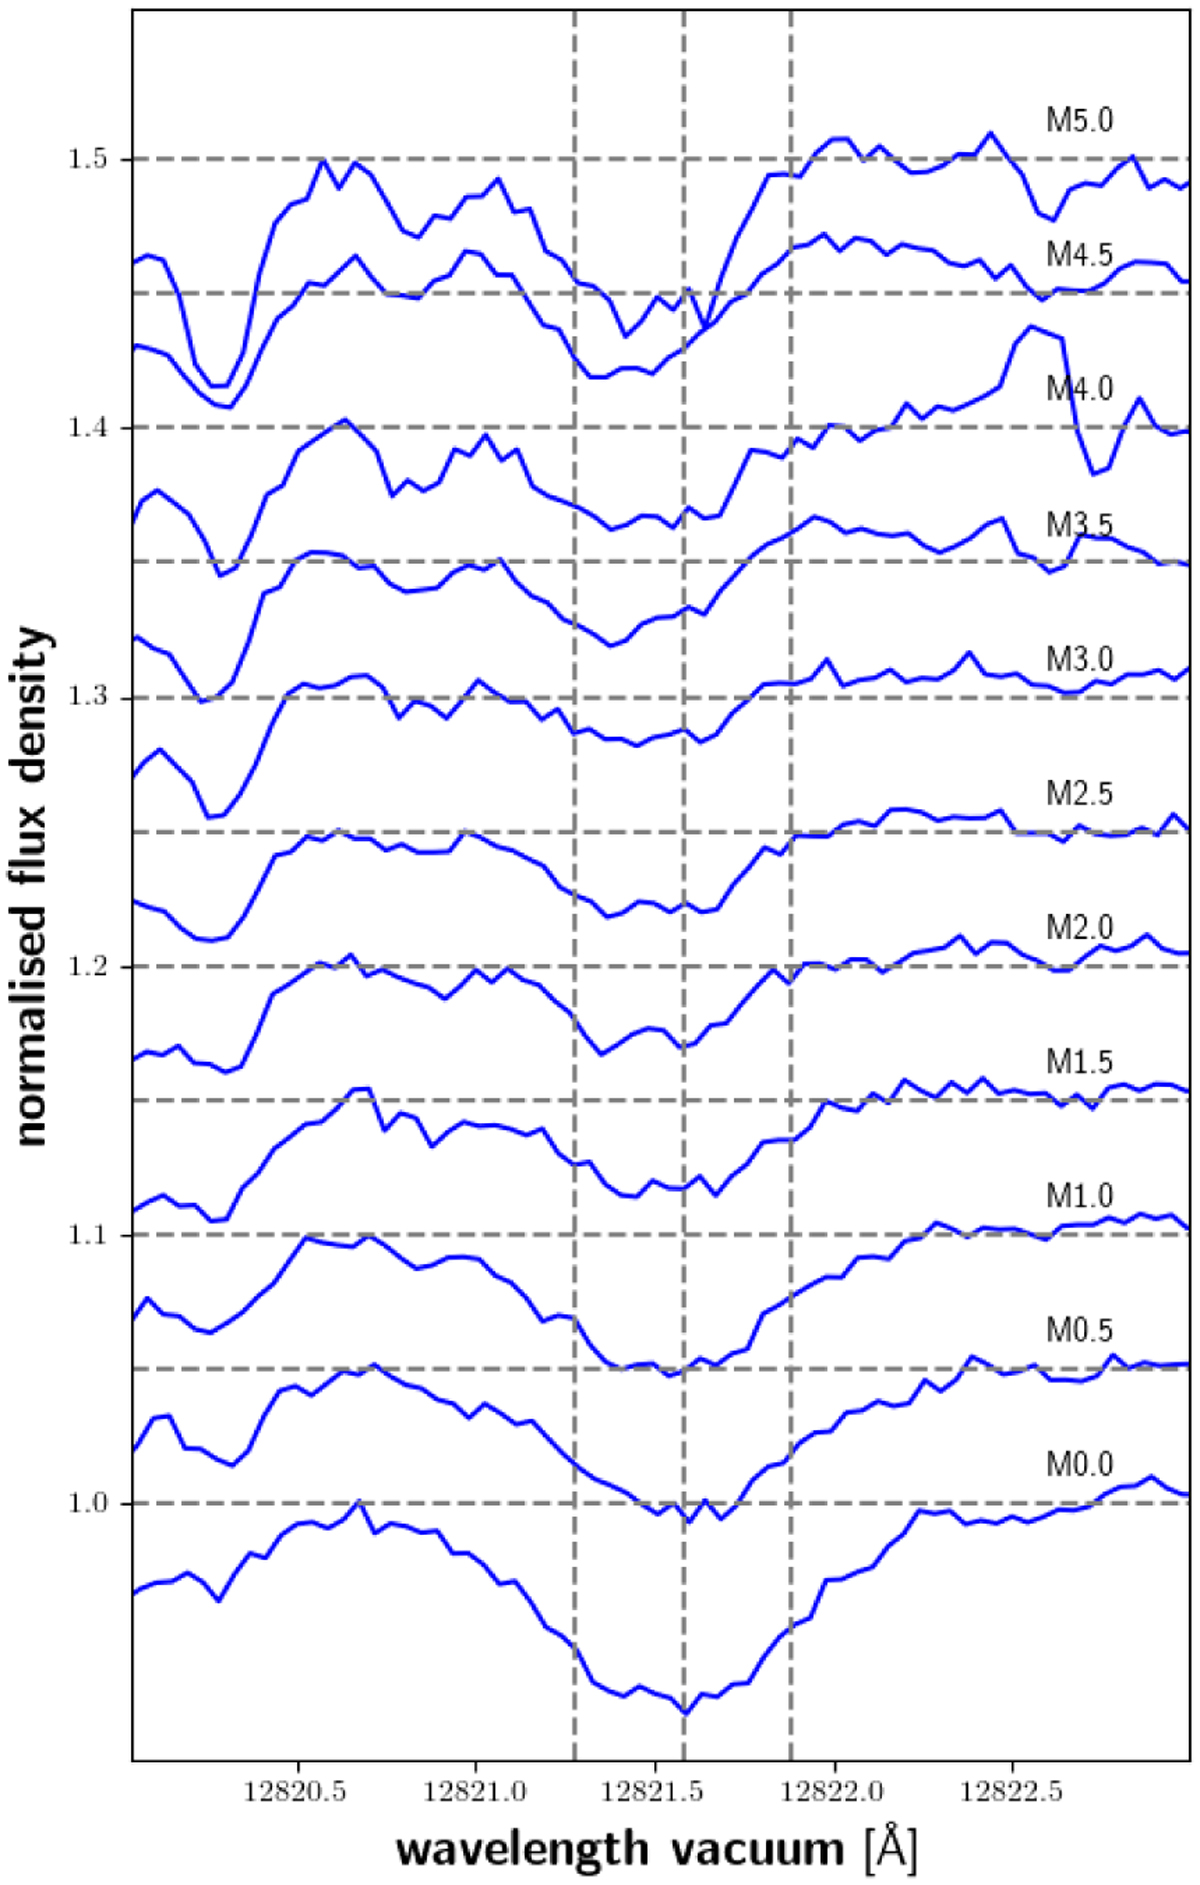
Spectral subtype sequence of the wavelength region around the Paβ line for stars with Hα in absorption. Spectra of stars later than M5.0 V are not shown, since they either show Hα emission or have a low signal-to-noise. Each normalised spectrum is offset for convenience (offset marked as a horizontal dashed line). The dashed vertical lines mark the central wavelength of the Paβ line and the lower and upper limit of the line integration band. From bottom to top the following stars are shown: J03463+262/HD 23453 (M0.0V), J02222+ 478/BD+47 612 (M0.5V), J00051+457/GJ 2 (M1.0V), J13196+333/ Ross 1007 (M1.5V), J01013+613/GJ 47 (M2.0V), J00389+306/ Wolf 1056 (M2.5V), J02015+637/G 244-047 (M3.0V), J12479+097/ Wolf 437 (M3.5V), J04311+589/STN 2051A (M4.0V), J08119+087/ Ross 619 (M4.5 V) J18165+048/G140-051 (M5.0 V).
Current usage metrics show cumulative count of Article Views (full-text article views including HTML views, PDF and ePub downloads, according to the available data) and Abstracts Views on Vision4Press platform.
Data correspond to usage on the plateform after 2015. The current usage metrics is available 48-96 hours after online publication and is updated daily on week days.
Initial download of the metrics may take a while.


