Open Access
Fig. 7.
Download original image
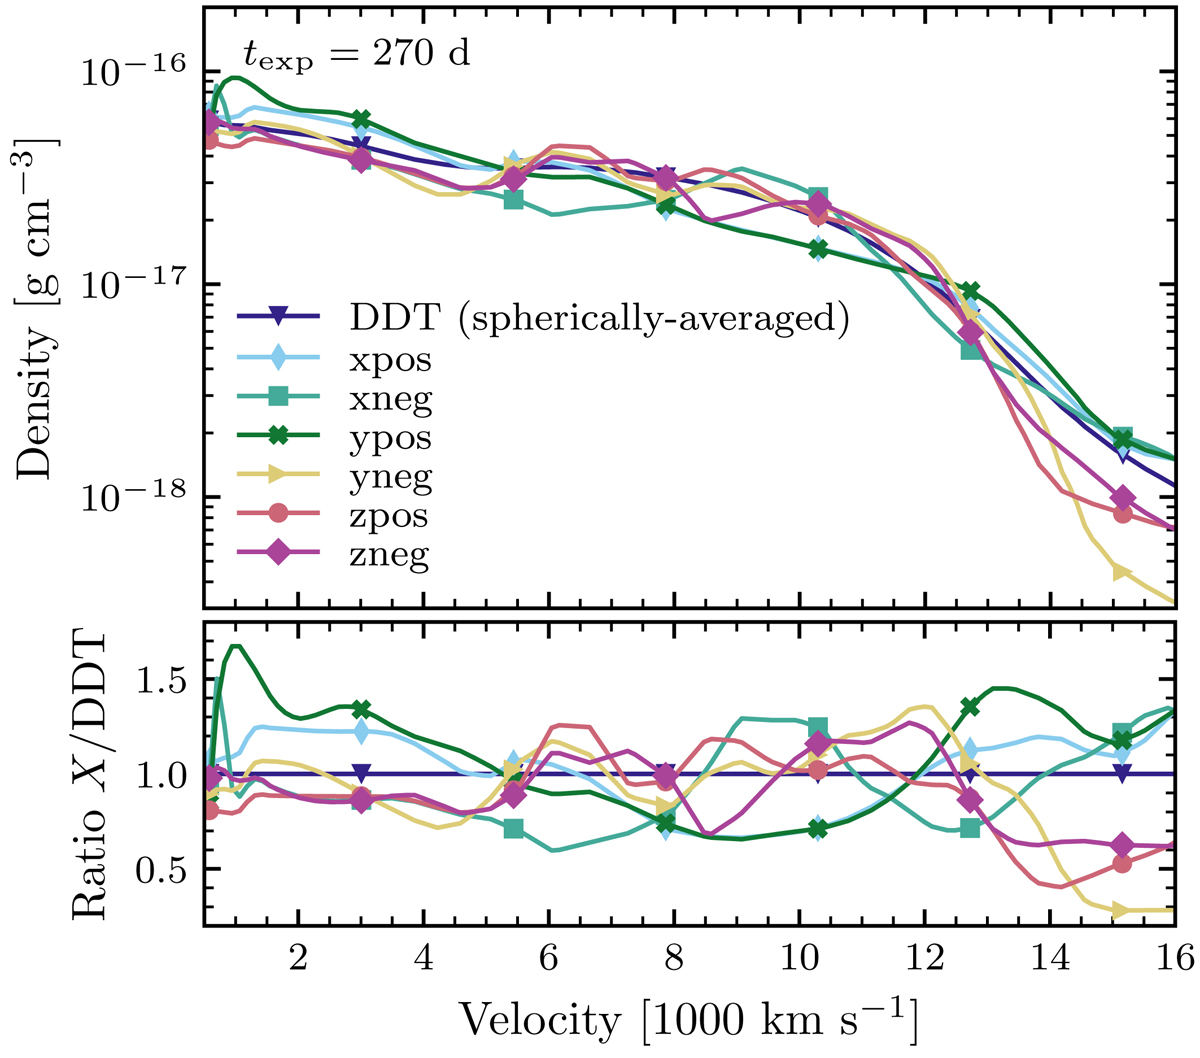
Density profiles for the spherically-averaged ddt_2013_N100 (DDT) model and along the three orthogonal axes of the original 3D Cartesian grid, in both positive ({x,y,z}pos) and negative ({x,y,z}neg) directions. The bottom panel shows the density ratio with respect to the DDT model.
Current usage metrics show cumulative count of Article Views (full-text article views including HTML views, PDF and ePub downloads, according to the available data) and Abstracts Views on Vision4Press platform.
Data correspond to usage on the plateform after 2015. The current usage metrics is available 48-96 hours after online publication and is updated daily on week days.
Initial download of the metrics may take a while.