Fig. 6.
Download original image
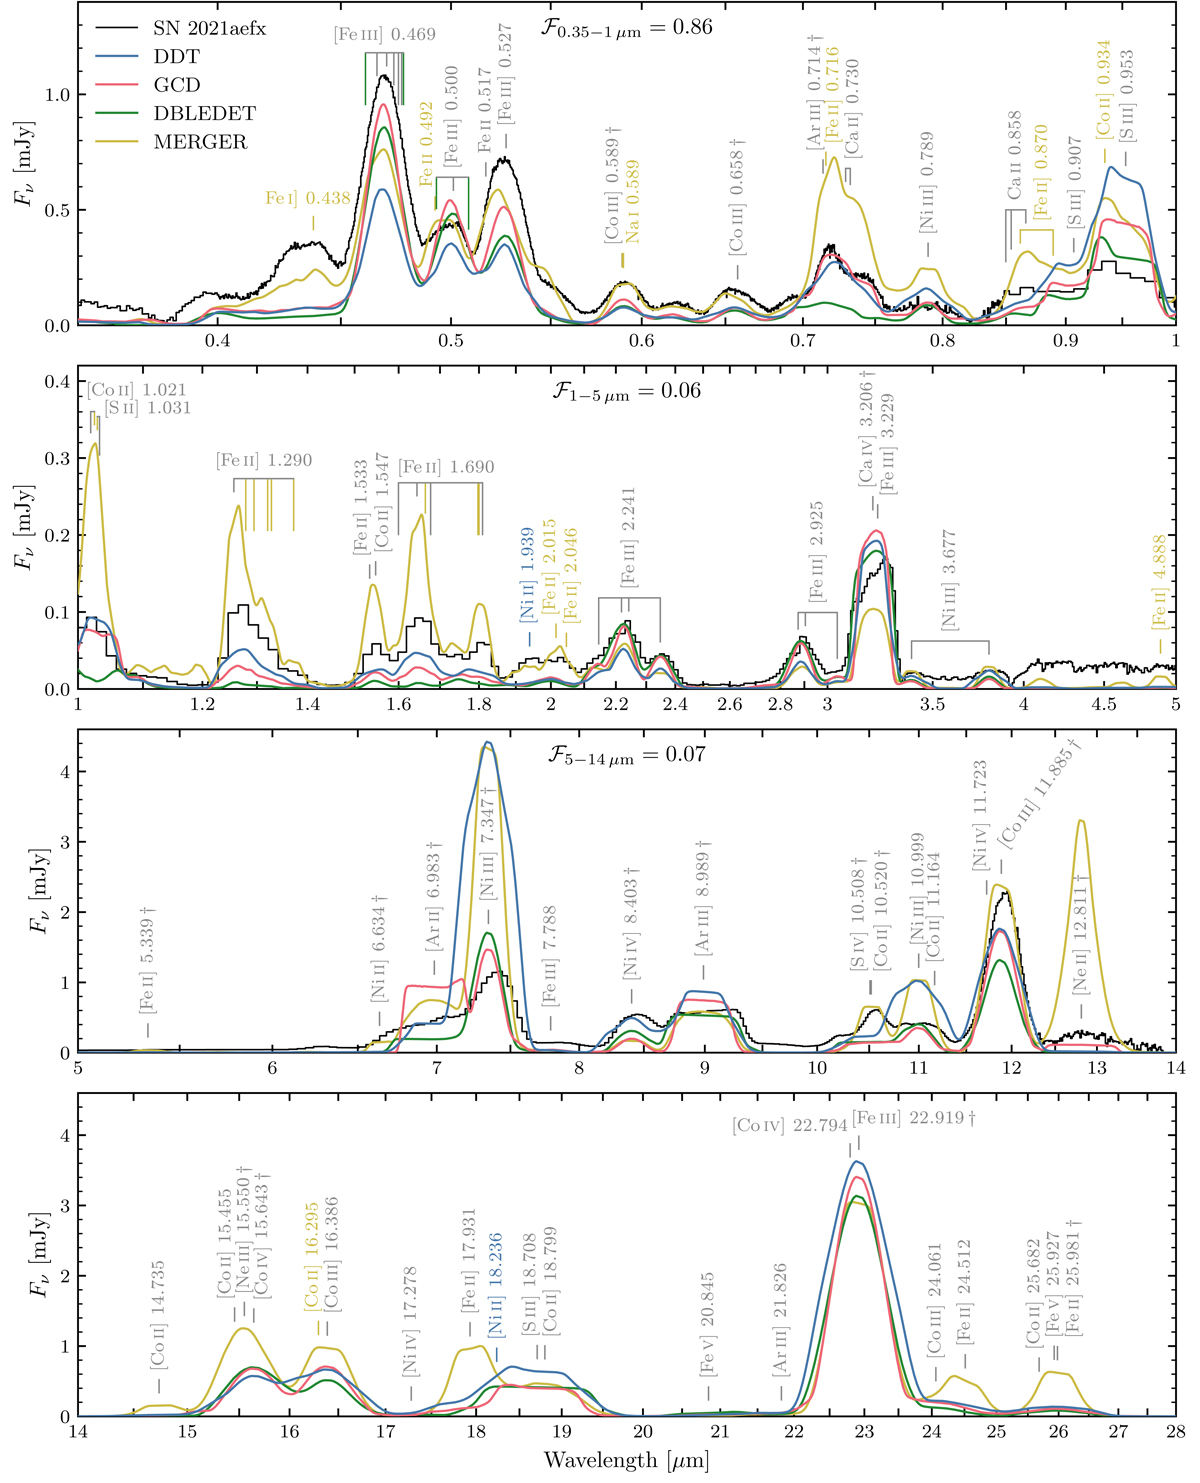
Same as Fig. 4 but for restricted wavelength ranges (from top to bottom): optical (0.35–1 μm), NIR (1–5 μm), lower MIR (5–14 μm) and upper MIR (14–28 μm). The ℱX−Y μm label gives the fraction of the total optical to MIR flux (0.35–14 μm) for SN 2021aefx emitted within the wavelength range of each plot. We include line identifications based on their Sobolev EW (see Table 2). Transitions connected to the ground state are marked with a ‘†’ symbol. For consecutive lines within a multiplet (connected by a horizontal line), we give the gf-weighted mean wavelength of the transitions. Lines that only appear in one model class are labelled with the corresponding colour.
Current usage metrics show cumulative count of Article Views (full-text article views including HTML views, PDF and ePub downloads, according to the available data) and Abstracts Views on Vision4Press platform.
Data correspond to usage on the plateform after 2015. The current usage metrics is available 48-96 hours after online publication and is updated daily on week days.
Initial download of the metrics may take a while.