Fig. 8.
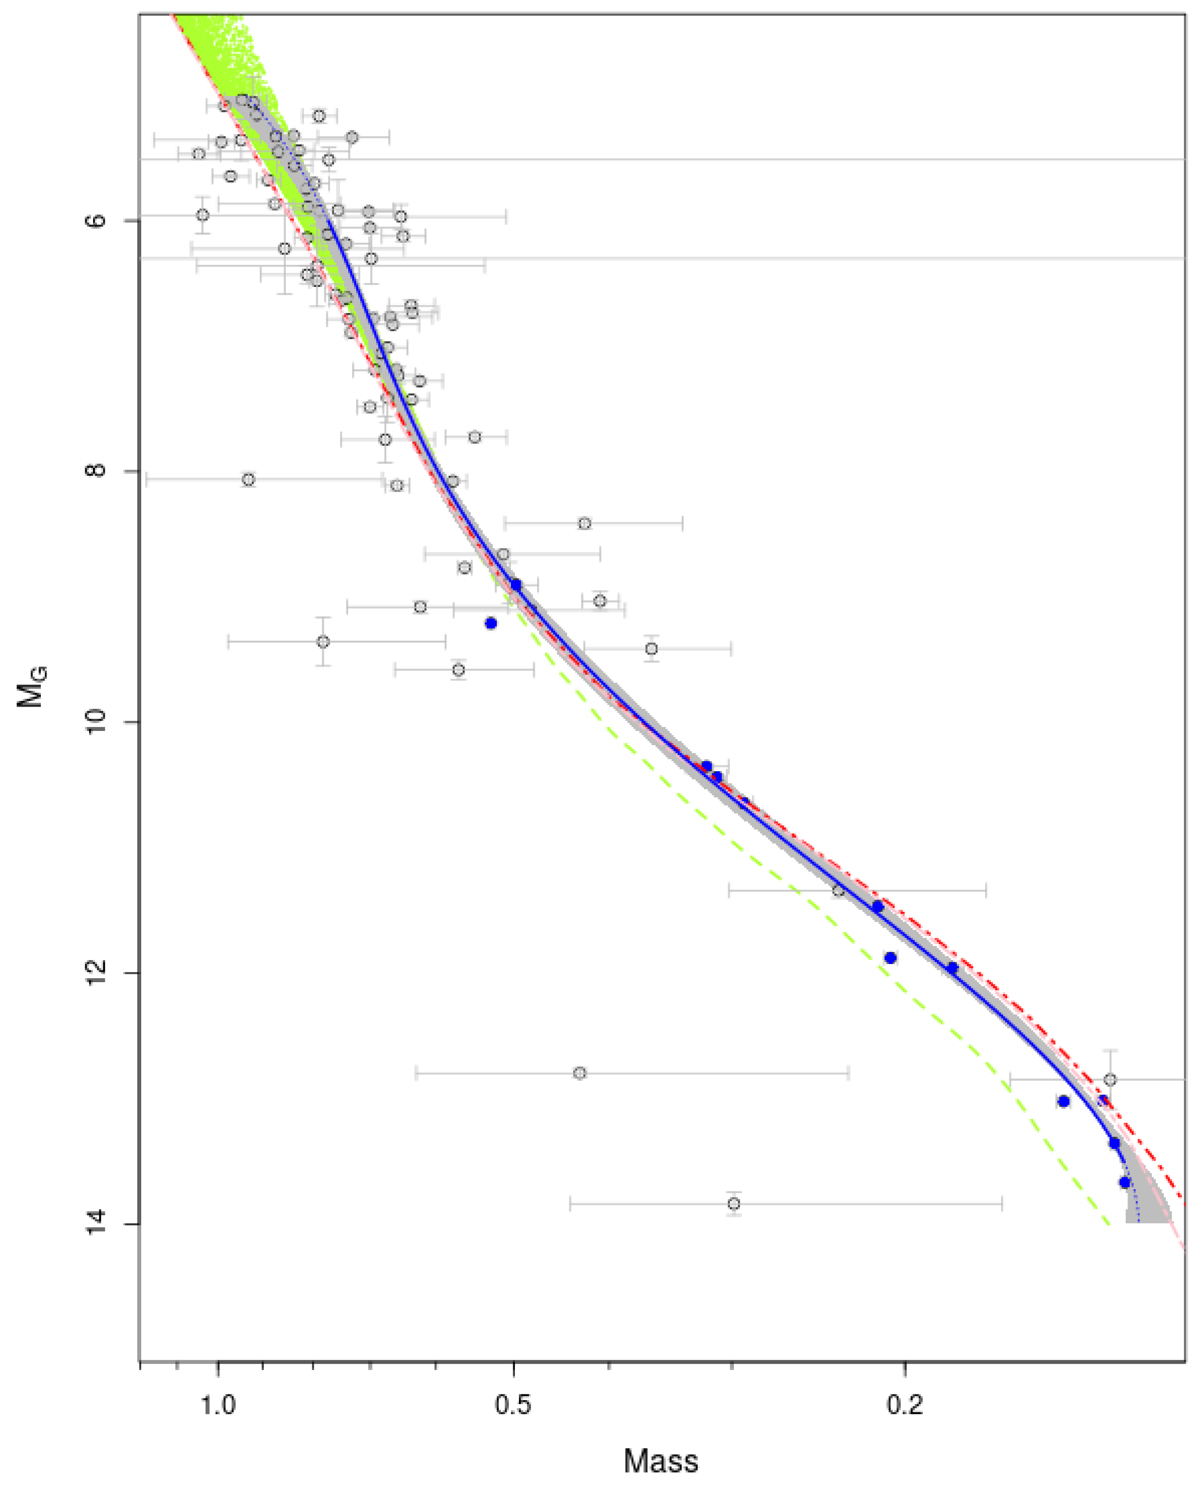
Download original image
Mass-luminosity relation fitted in this work (in blue). The areas outside the 6 < MG < 13.5 range are shown by the dotted line. The grey area corresponds to the 1σ bootstrap interval. The stars from Table 3 (resolved Gaia stars with direct-imaging data) are plotted in blue, and stars from Tables 1 and 2 (SB2 data combined with Gaia NSS astrometric solution) are shown in grey. The dashed green lines show the solar metallicity PARSEC isochrones for main-sequence stars (isochrones with the label 1). The dot-dashed red line and the two-dash pink line are the solar metallicity isochrone of Baraffe et al. (2015) and BASTI, respectively; they only deviate at masses lower than ∼ 0.12 ℳ⊙.
Current usage metrics show cumulative count of Article Views (full-text article views including HTML views, PDF and ePub downloads, according to the available data) and Abstracts Views on Vision4Press platform.
Data correspond to usage on the plateform after 2015. The current usage metrics is available 48-96 hours after online publication and is updated daily on week days.
Initial download of the metrics may take a while.