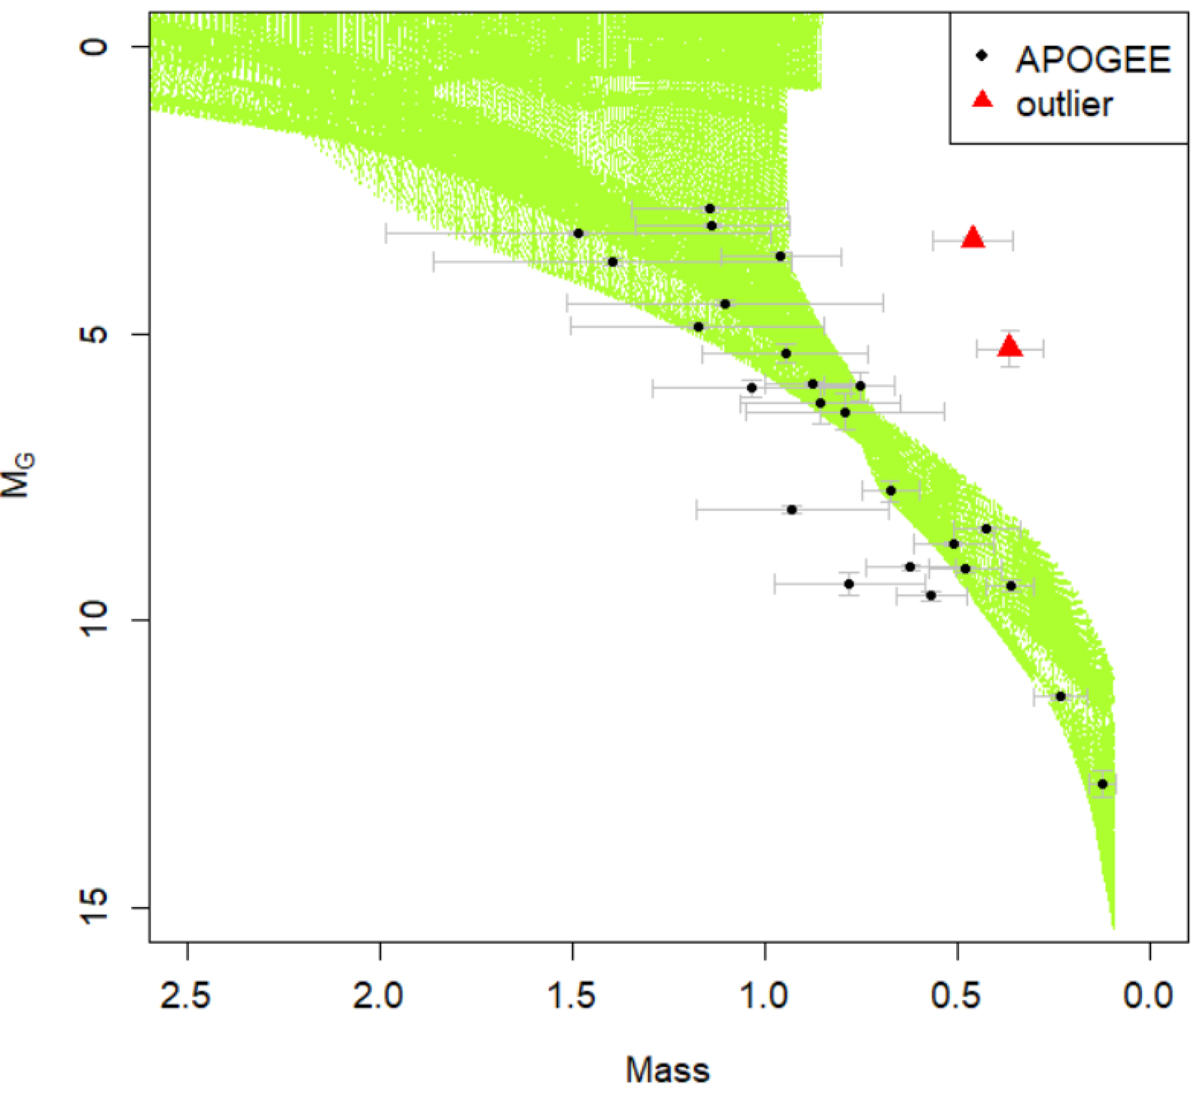
Fig. 3.
Download original image
Mass-luminosity diagram of the characterized stars from the combination of Gaia with APOGEE. The error bars at 1σ are given in grey. The absolute magnitude of the individual stars in the G band MG is plotted as a function of the stellar mass (in ℳ⊙). The black dots represent the stars, and the associated error bars at 1σ are shown in grey. The red triangles represent the outlier Gaia DR3 ID 5285071954833306368. They are overplotted on the isochrones (in green).
Current usage metrics show cumulative count of Article Views (full-text article views including HTML views, PDF and ePub downloads, according to the available data) and Abstracts Views on Vision4Press platform.
Data correspond to usage on the plateform after 2015. The current usage metrics is available 48-96 hours after online publication and is updated daily on week days.
Initial download of the metrics may take a while.