Fig. 2.

Download original image
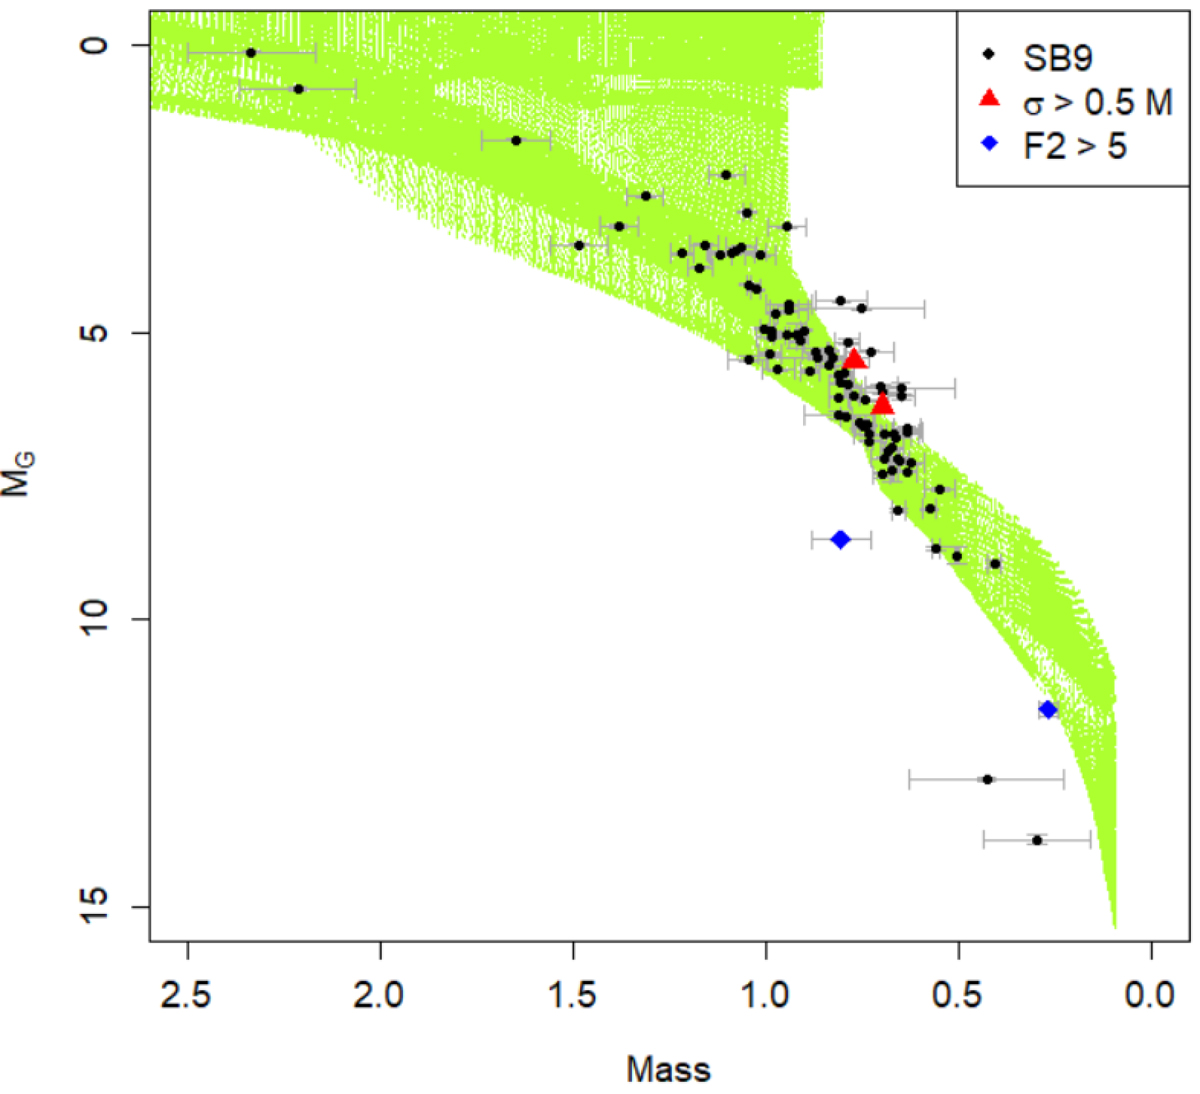
Mass-luminosity diagram of the characterized stars from the combination of Gaia with SB9. The error bars at 1σ are given in grey. The absolute magnitude of the individual stars in the G band MG is plotted as a function of the stellar mass (in ℳ⊙). The black dots represent the stars, and the associated error bars at 1σ are shown in grey. The red triangles represent Gaia DR3 3954536956780305792, for which the uncertainties are really large and not represented here. The blue diamonds represent Gaia DR3 3427930123268526720, for which F2 > 5. They are overplotted on the solar-metallicity PARSEC isochrones (in green).
Current usage metrics show cumulative count of Article Views (full-text article views including HTML views, PDF and ePub downloads, according to the available data) and Abstracts Views on Vision4Press platform.
Data correspond to usage on the plateform after 2015. The current usage metrics is available 48-96 hours after online publication and is updated daily on week days.
Initial download of the metrics may take a while.


