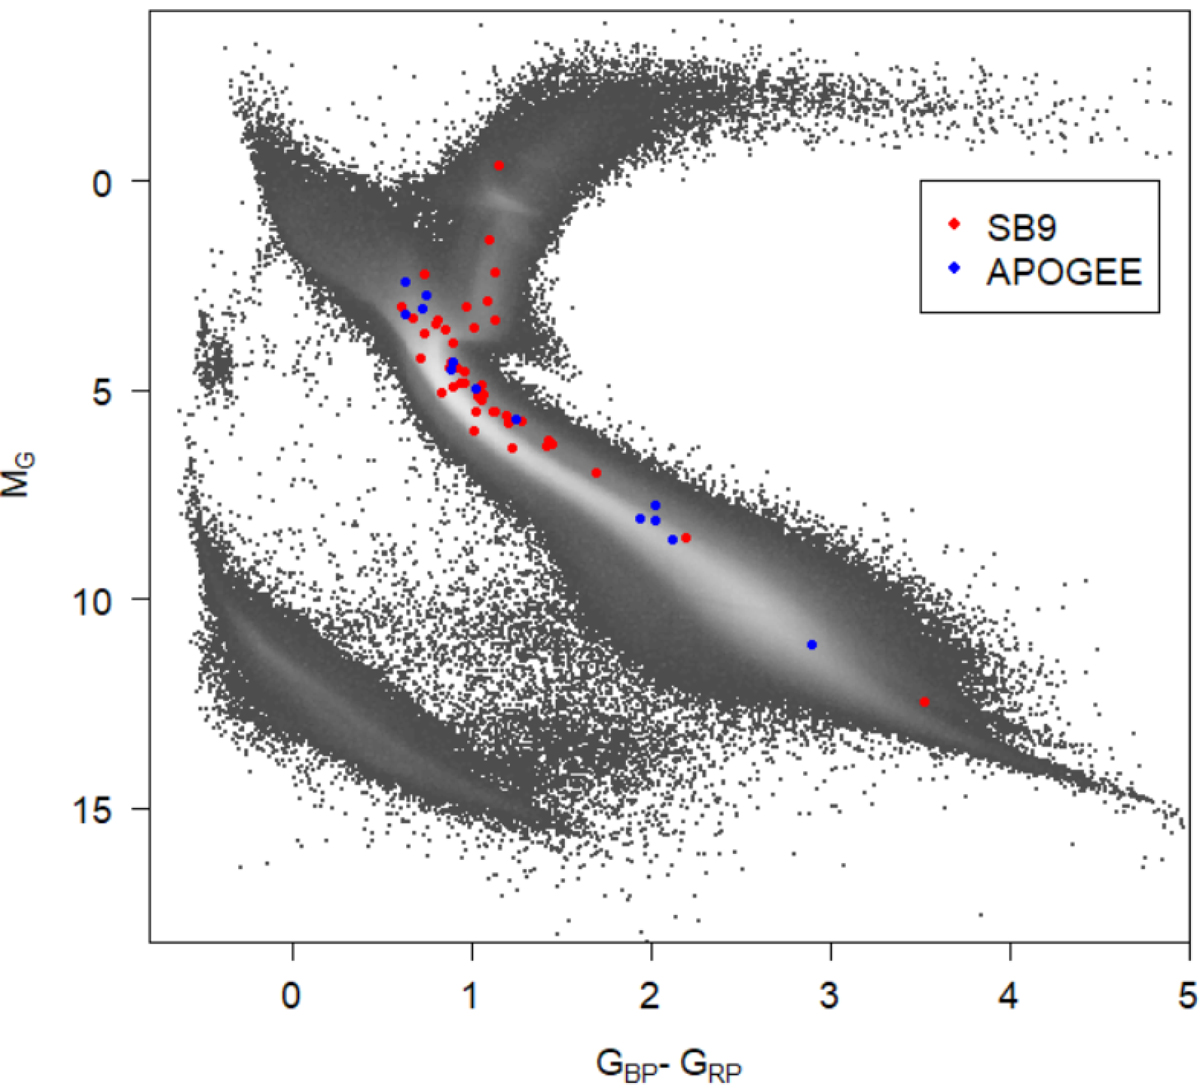
Fig. 1.
Download original image
Hertzsprung-Russel diagram of the characterized binaries. The absolute magnitude of the unresolved binary in the G band MG is plotted as a function of the colour GBP − GRP. The blue dots correspond to the APOGEE binaries, and the red dots correspond to the SB9 binaries. They are overplotted on the low-extinction Gaia DR3 HR diagram (in grey).
Current usage metrics show cumulative count of Article Views (full-text article views including HTML views, PDF and ePub downloads, according to the available data) and Abstracts Views on Vision4Press platform.
Data correspond to usage on the plateform after 2015. The current usage metrics is available 48-96 hours after online publication and is updated daily on week days.
Initial download of the metrics may take a while.