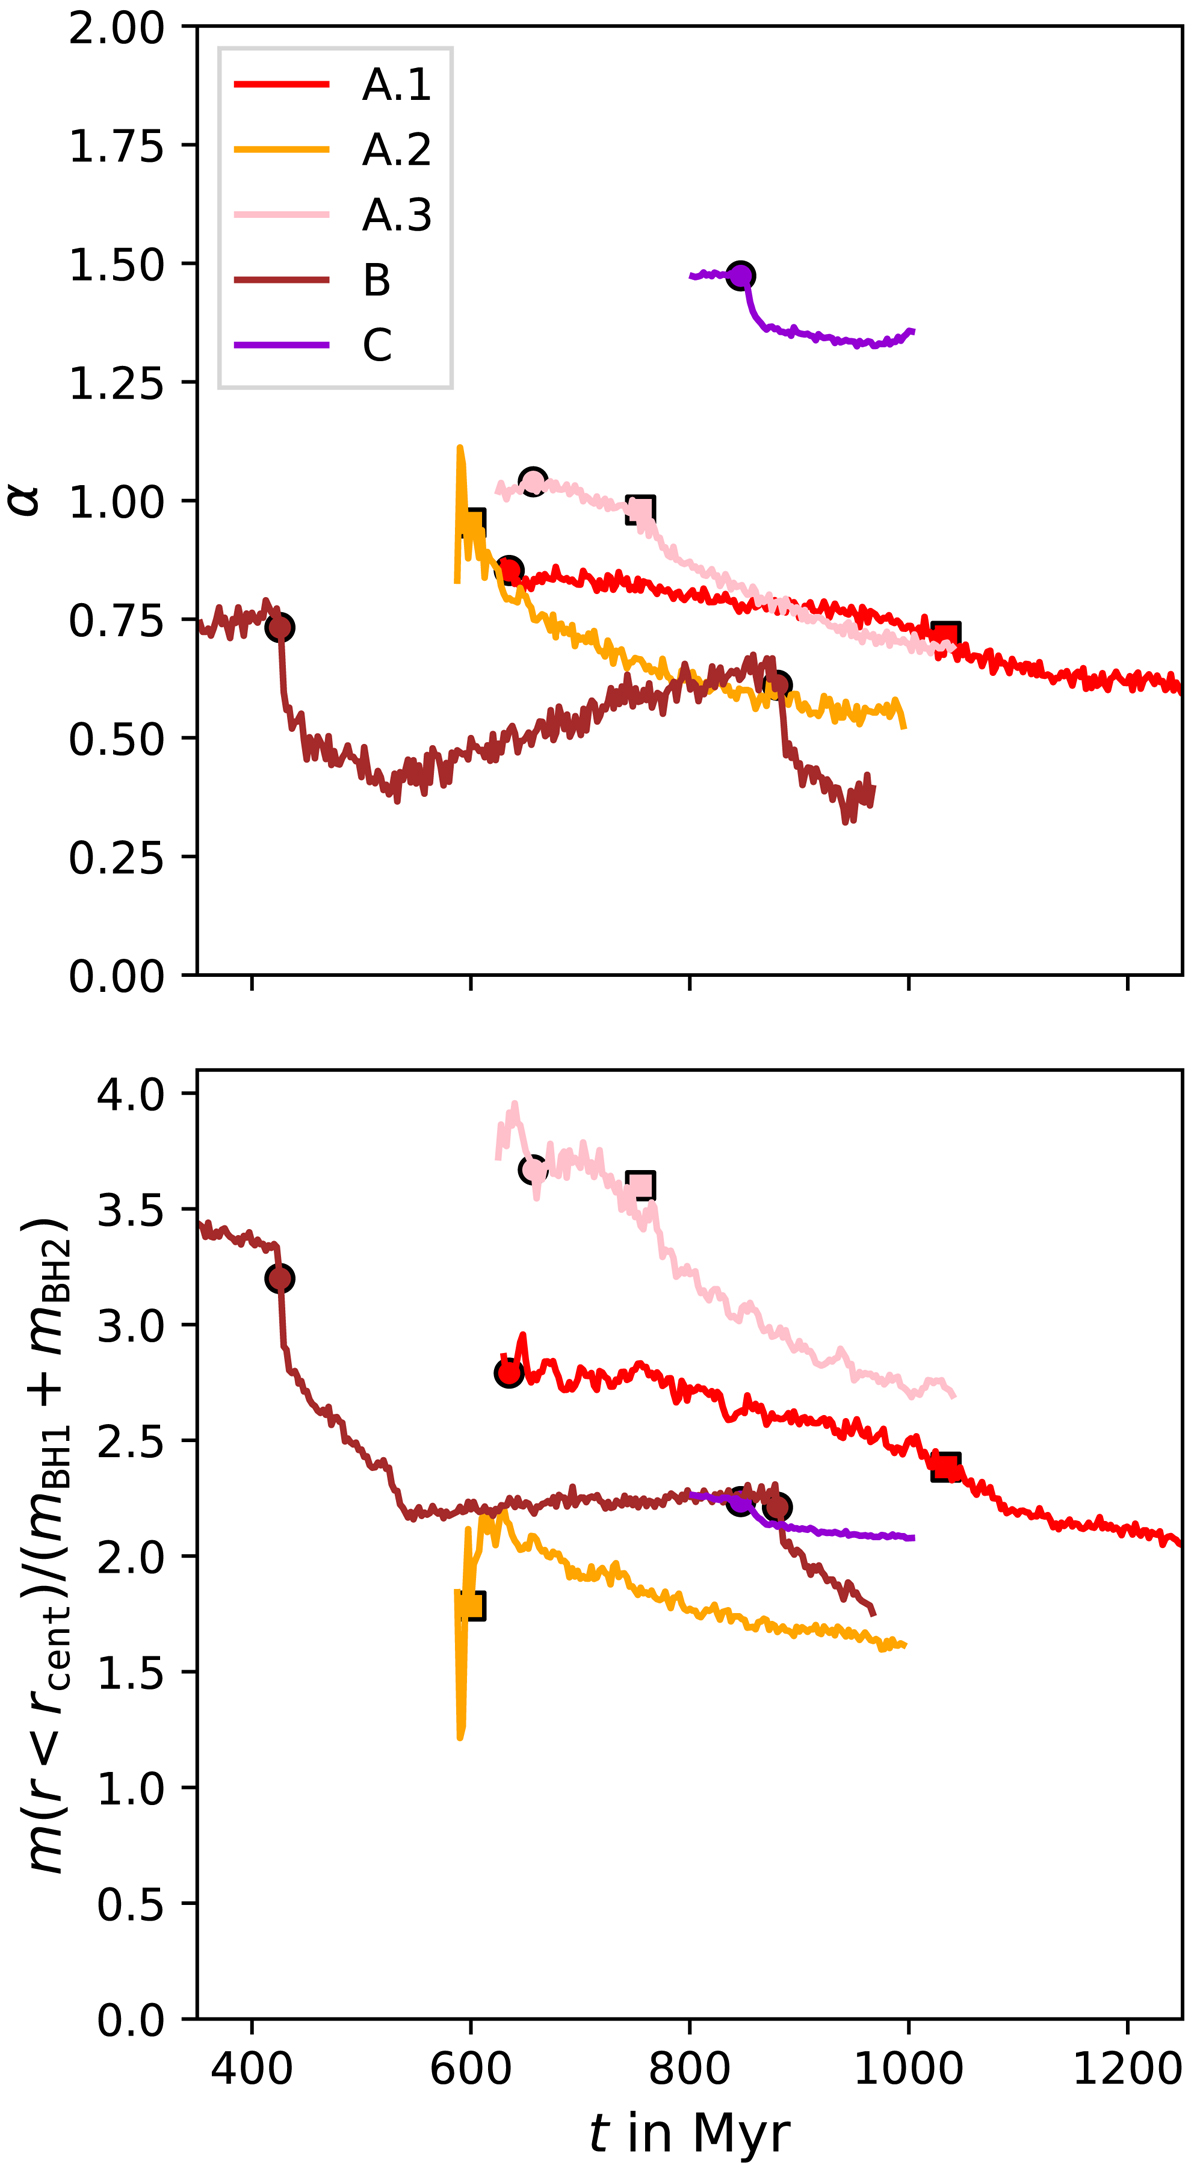
Fig. 4.
Download original image
Time evolution of the central stellar density slope α (top) and total mass (bottom) inside the galactic center given in terms of the total binary mass. The slope and mass were determined in a sphere around the central binary. The sphere’s radius rcent was approximately the binary influence radius and set to 300 pc in A.1–A.3, 20 pc in B, and 100 pc in C. The different simulations are color-coded according to the legend. Sudden jumps in the slope and mass coincide with the beginning of direct chaotic triple SMBH interactions (squares) or the formation of bound binaries (circles).
Current usage metrics show cumulative count of Article Views (full-text article views including HTML views, PDF and ePub downloads, according to the available data) and Abstracts Views on Vision4Press platform.
Data correspond to usage on the plateform after 2015. The current usage metrics is available 48-96 hours after online publication and is updated daily on week days.
Initial download of the metrics may take a while.