Fig. 3.
Download original image
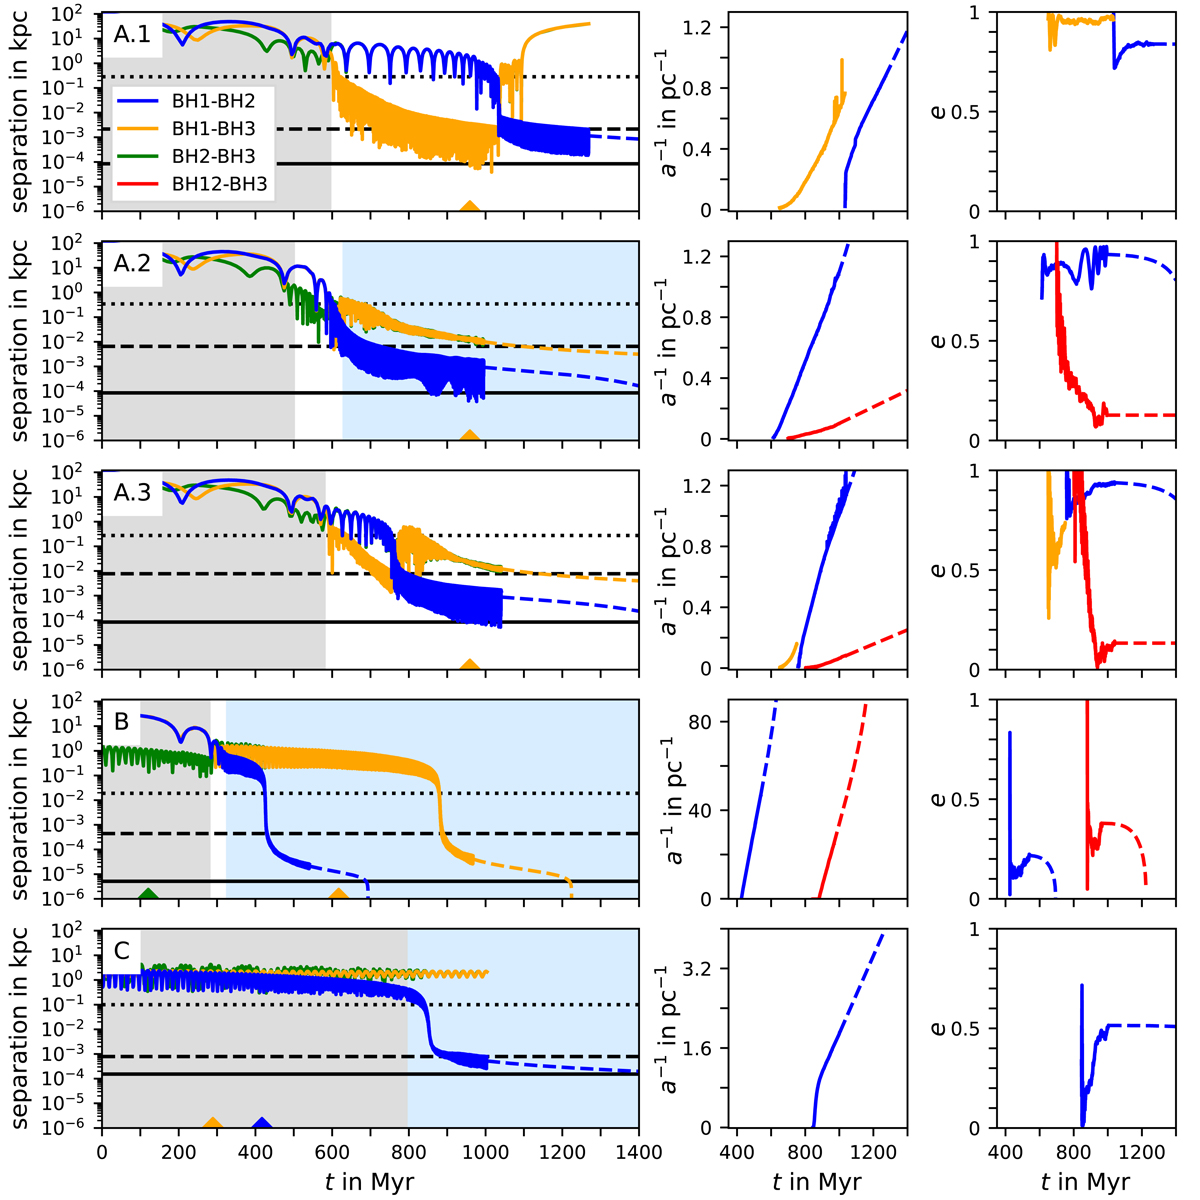
Black hole orbital parameters across the different simulations A.1 (top row) to C (bottom row). The color coding refers to different SMBH pairs. In A.2 and A.3, the red lines refer to the outer orbit of the hierarchical triple, in B the red lines refer to the BH3 orbit around the BH1–BH2 merger remnant. Background colors mark the codes used during the particular simulation period, light gray for bonsai2, white for φ−GPU, and light blue for φ−GRAPE−hybrid. The left panels show the separation of different SMBH pairs. The black dotted, dashed, and solid lines respectively mark the influence radius, hardening radius, and the factor 1000 of the Schwarzschild radius of BH1. The color-coded bottom triangles mark the merger time point of an SMBH pair in ROMULUS25. The middle panels show the evolution of the inverse semi-major axis, the right panels the eccentricity evolution for bound SMBH systems. The colored dashed lines show the analytic projection of a, a−1 and e using Eqs. (7) and (8) after the simulation has been finished.
Current usage metrics show cumulative count of Article Views (full-text article views including HTML views, PDF and ePub downloads, according to the available data) and Abstracts Views on Vision4Press platform.
Data correspond to usage on the plateform after 2015. The current usage metrics is available 48-96 hours after online publication and is updated daily on week days.
Initial download of the metrics may take a while.