Fig. 2.
Download original image
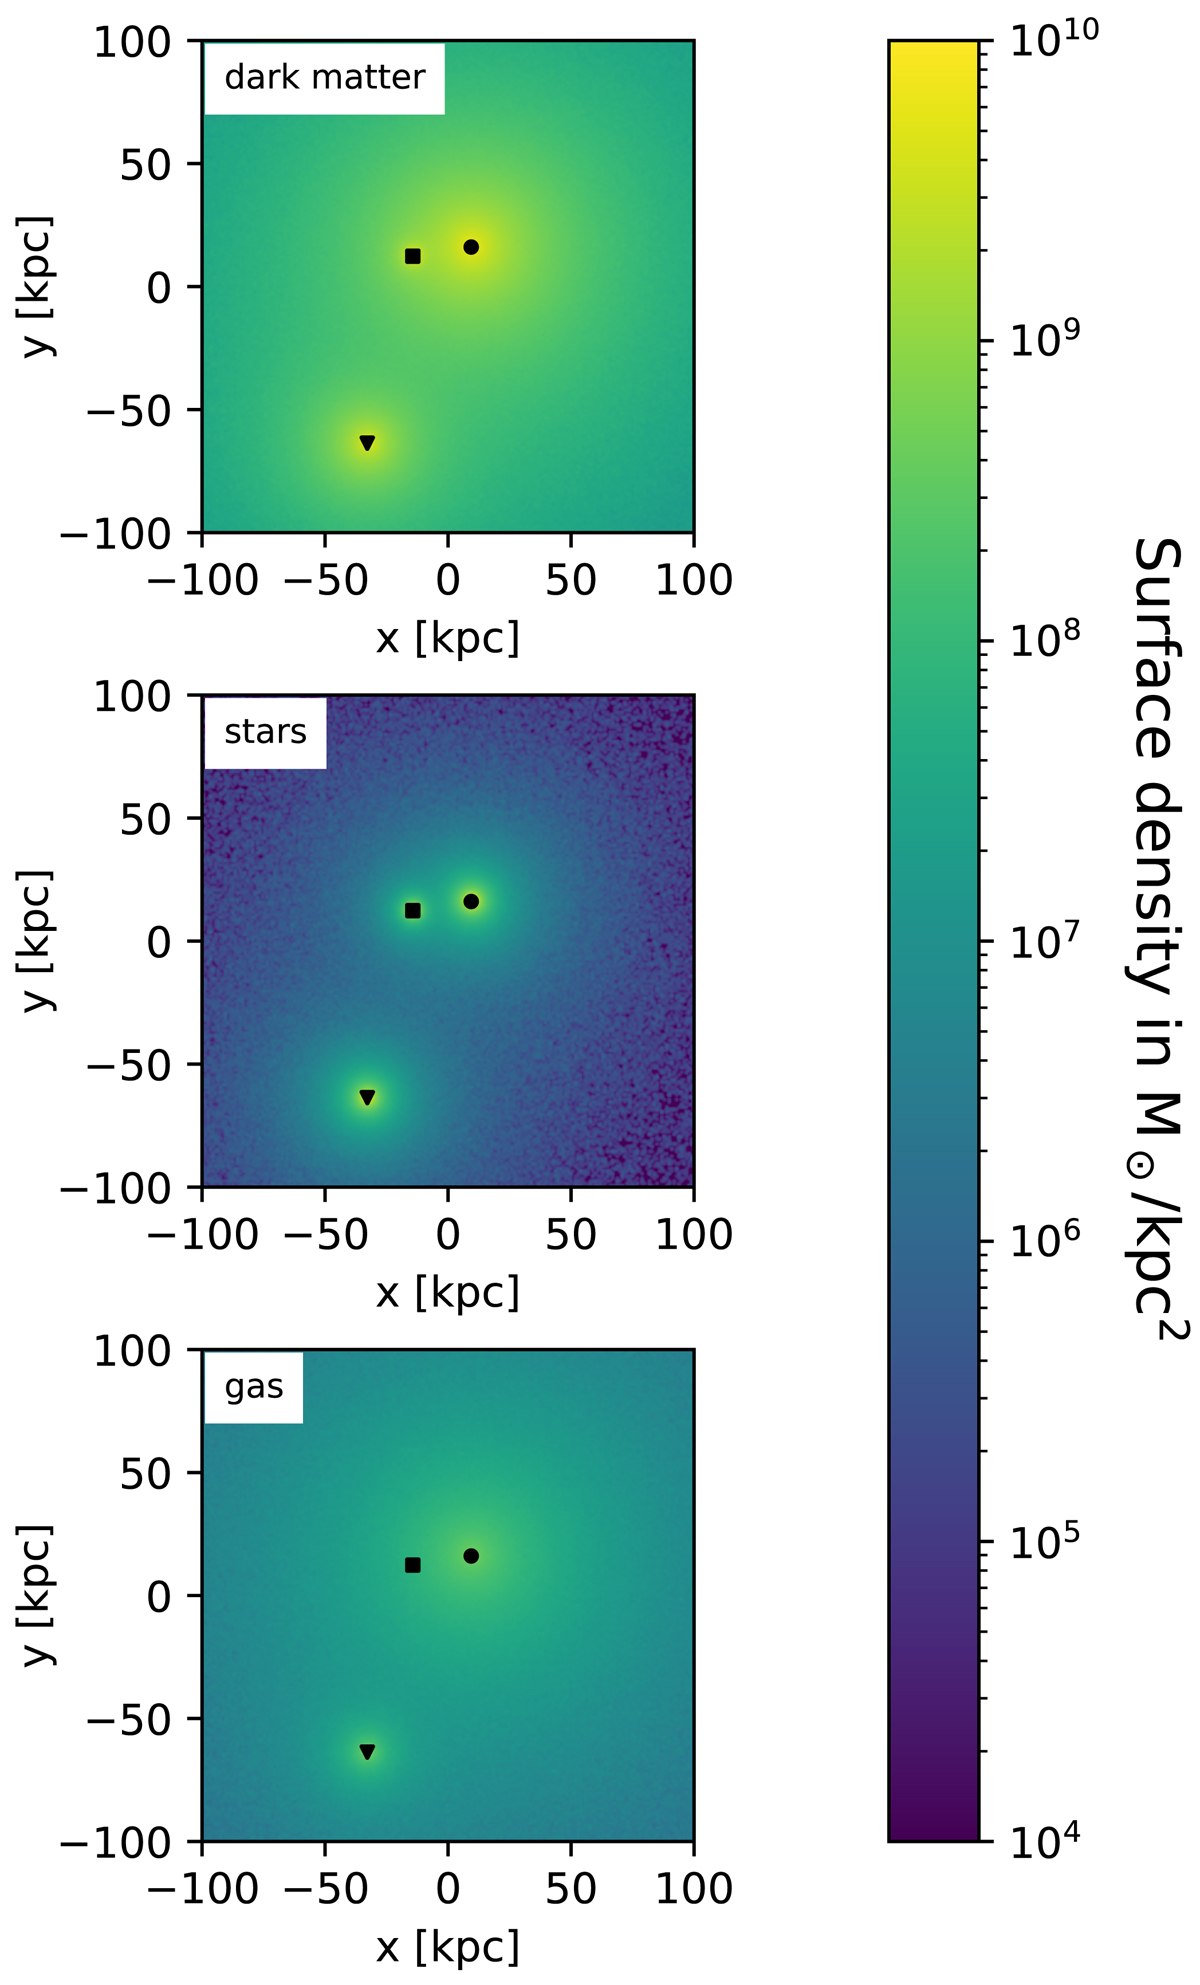
Surface density plot of initial condition A.1 reconstructed from ROMULUS25 system A. The top panel shows the distribution of the dark matter component, the middle panel the stars, and at the bottom the gas. The heaviest black hole BH1 is represented by the black dot, BH2 by the triangle, and BH3 by the square. Galaxy 3 did not contain any gas, therefore, no overdensity around BH3 is present in the bottom plot.
Current usage metrics show cumulative count of Article Views (full-text article views including HTML views, PDF and ePub downloads, according to the available data) and Abstracts Views on Vision4Press platform.
Data correspond to usage on the plateform after 2015. The current usage metrics is available 48-96 hours after online publication and is updated daily on week days.
Initial download of the metrics may take a while.