Fig. 5
Download original image
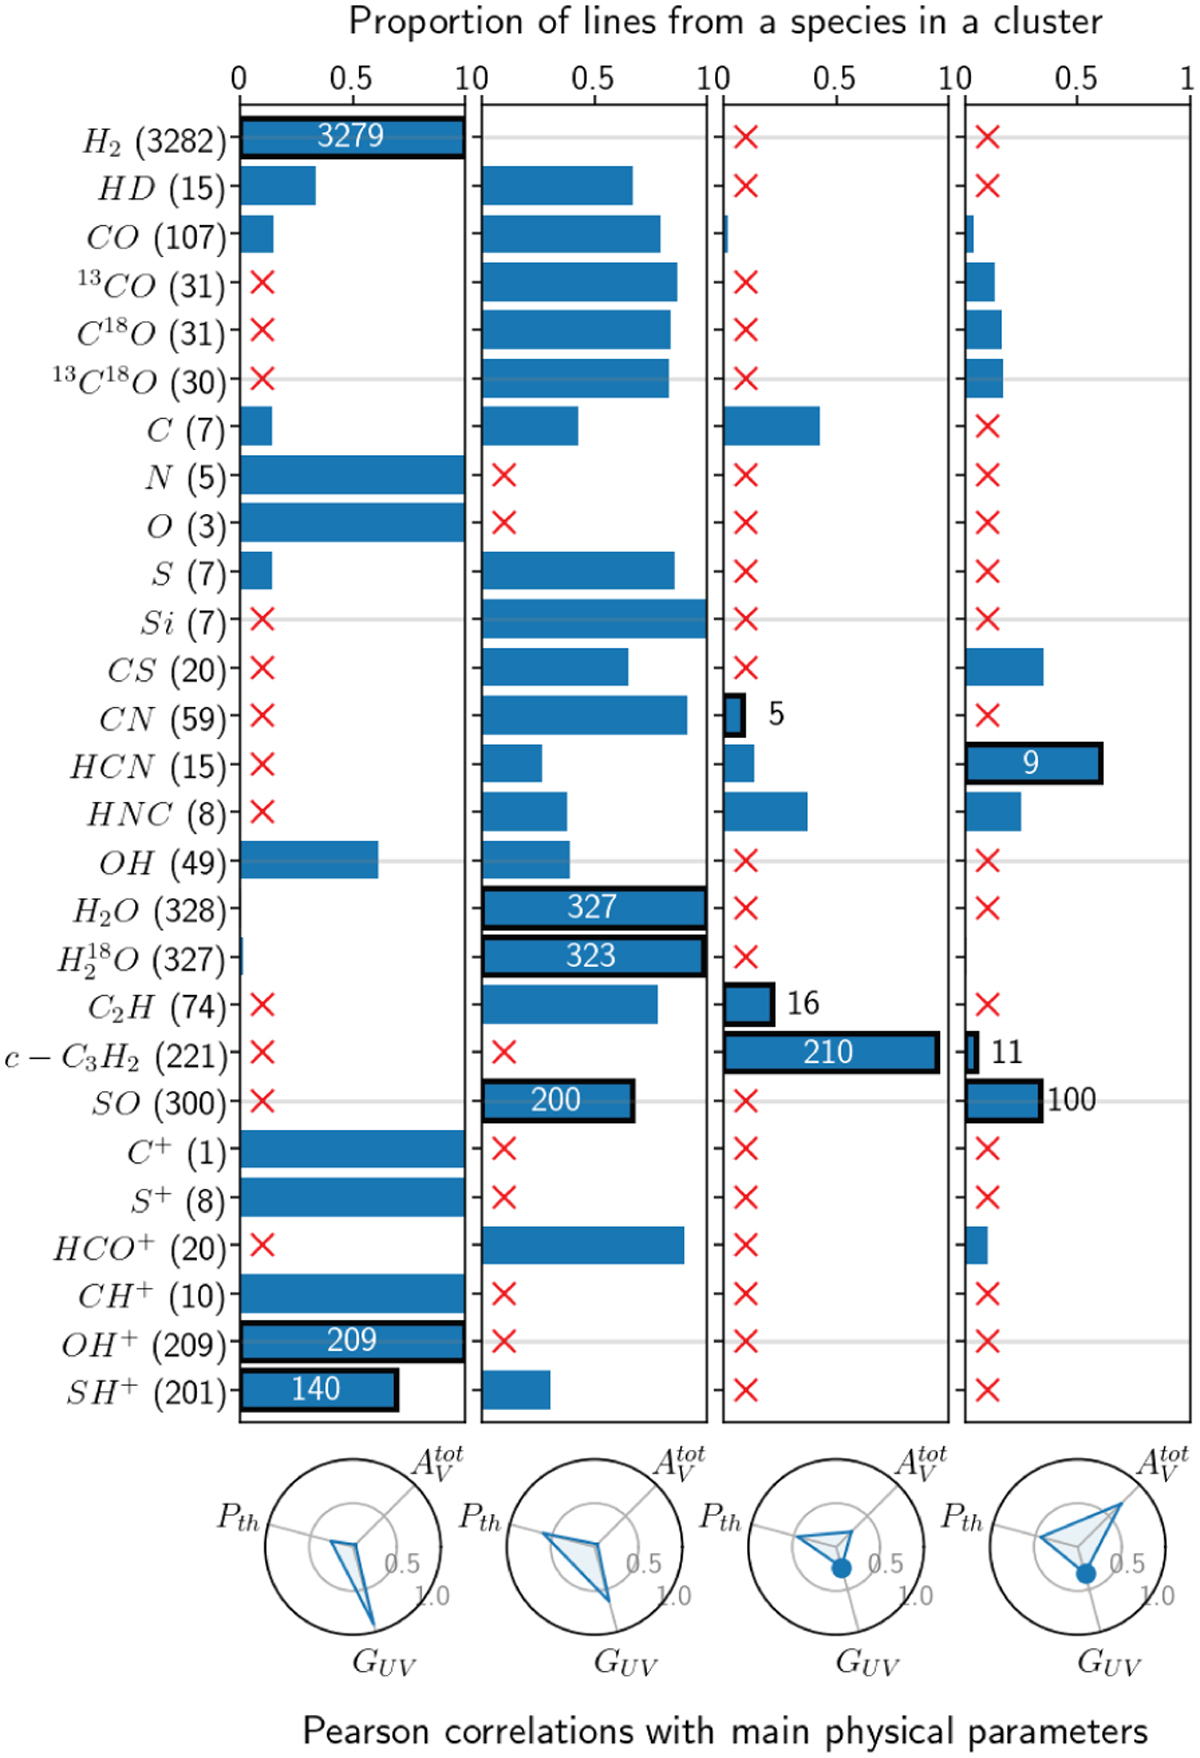
Description of the four obtained line clusters. Top row: composition of each cluster. Each bar indicates the proportion of lines of a species in a cluster. The red crosses correspond to exactly zero line. For each cluster, the three species with most lines and the corresponding number of lines are highlighted. Bottom row: Pearson correlation of the most representative line of each cluster with the three main physical parameters. The most representative line of a cluster is defined as the line with the highest average correlation with the other lines. A round marker at a vertex indicates a negative correlation.
Current usage metrics show cumulative count of Article Views (full-text article views including HTML views, PDF and ePub downloads, according to the available data) and Abstracts Views on Vision4Press platform.
Data correspond to usage on the plateform after 2015. The current usage metrics is available 48-96 hours after online publication and is updated daily on week days.
Initial download of the metrics may take a while.